Anthropic S-1: Explosive Growth, Compute Contracts, and the Price of an IPO
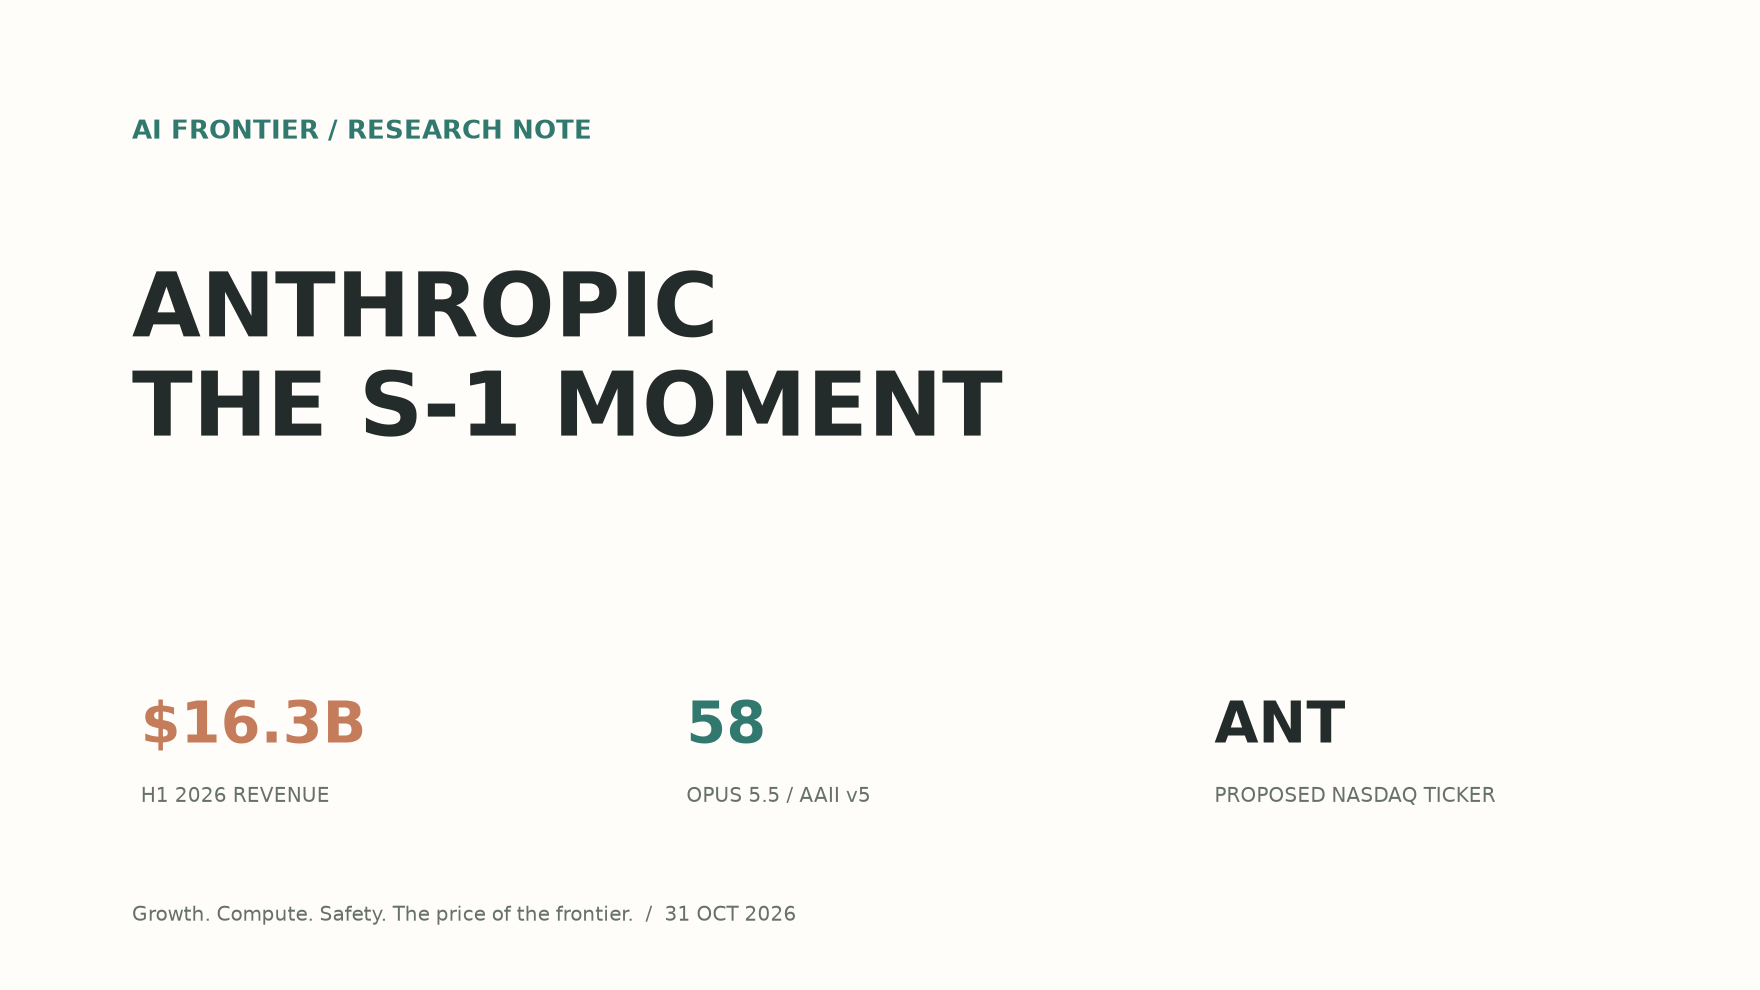
As of October 31, 2026. B = billion US dollars; T = trillion US dollars. Filed results, reporting, and this article’s forecasts are distinguished below.
- Growth: H1 revenue $16.3B, 14× a year earlier. Reuters reports Q3 revenue of $16.8B.
- Profitability: H1 operating loss $0.69B. Most of the $80.75B net loss comes from financial-instrument remeasurement.
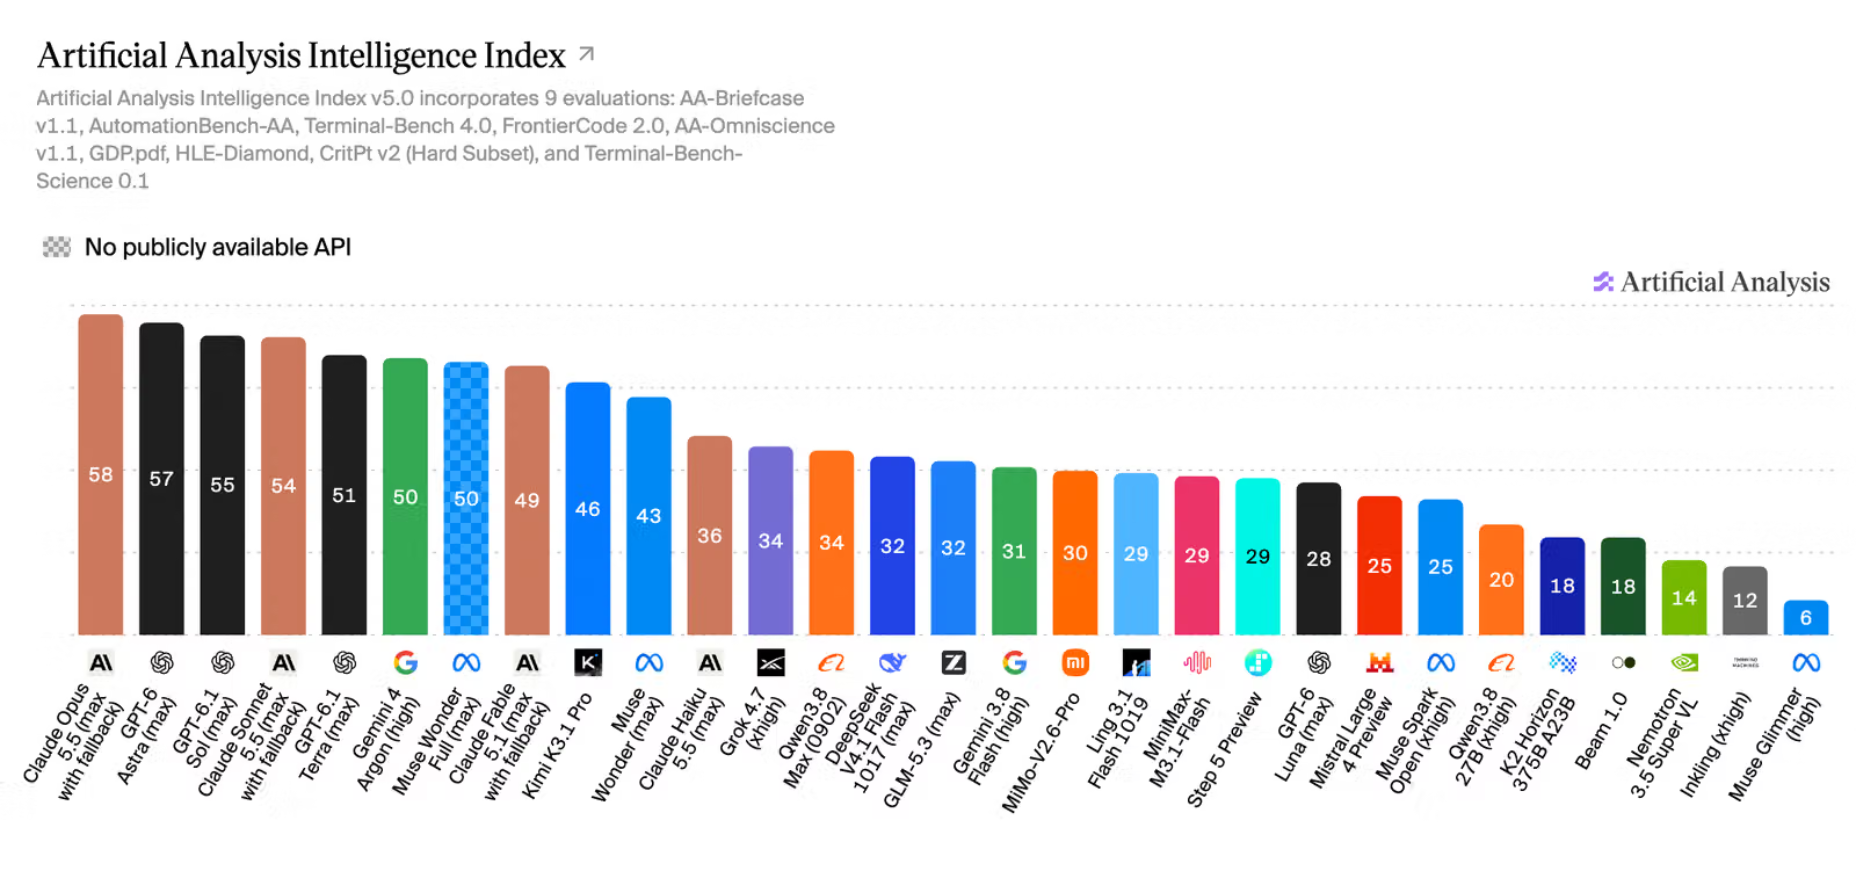
- Product: Opus 5.5 ranked first at 58 when AAII v5 launched. Carbon overtook it at 59 the next day.
- Price: Reported IPO expectations of $1.5–2T put it alongside Meta and Broadcom, each currently around $1.6T.
Original: Anthropic S-1 · Further reading: EO’s S-1 analysis
1. Growth: Customer spending is expanding even faster
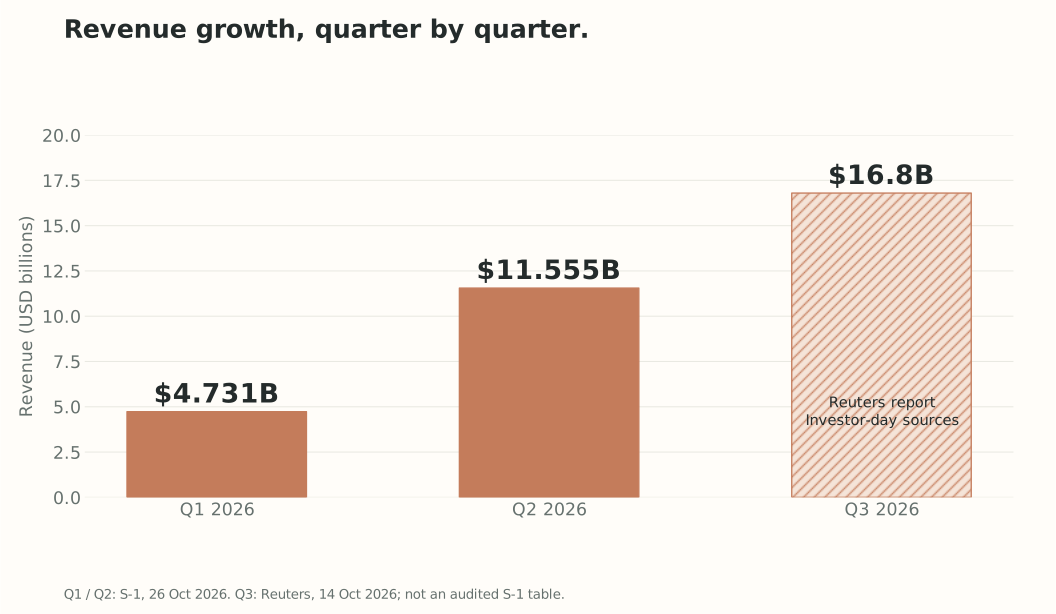
- H1 $1.163B → $16.286B: Roughly 14× year over year.
- Q3 $16.8B: About 45% above Q2. Reuters reporting, rather than a finalized filed result.
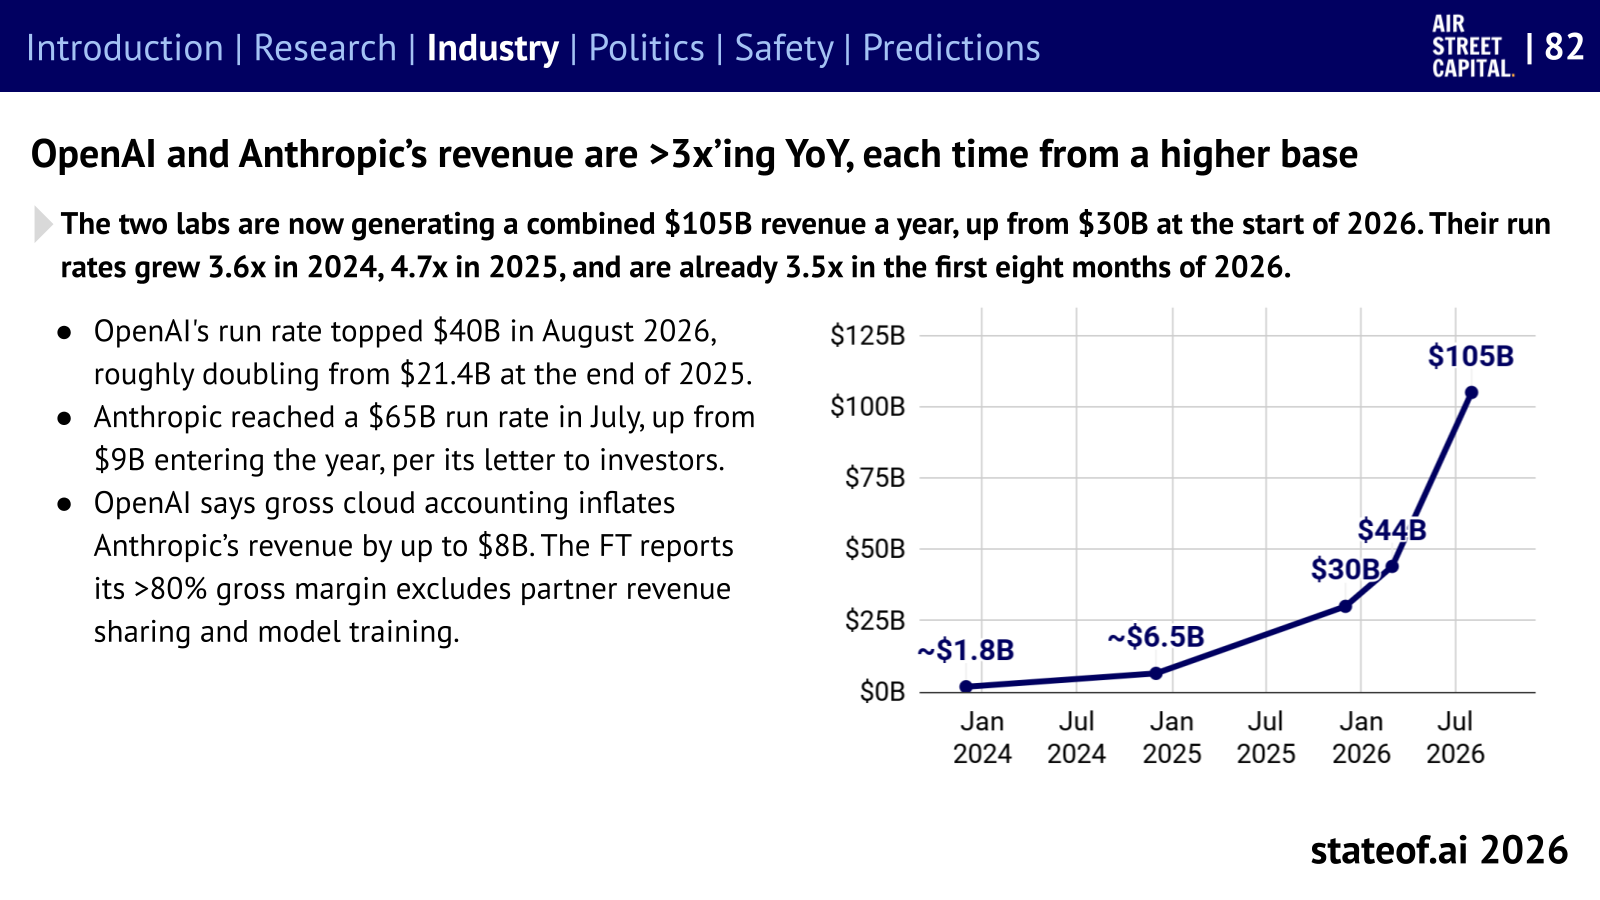
- Year-end $110B: An analyst’s annualized revenue forecast. It extends the expected year-end pace over 12 months; it is not actual full-year 2026 revenue.
- Customers spending at least $100K annually: 950 → 11,900. September 2025 → September 2026. Of these, 1,900 customers exceed $1M, showing a widening large-customer base.
- September 2026 NRR: 900%. The same existing customer cohort spent 9× as much in the quarter as a year earlier. Excludes individual Pro and Max plans. New customers and deeper usage both drive growth.
Sources: S-1 customer metrics and NRR definition, Reuters, October 14.
2. Finance: An $80.7B net loss can coexist with an operating profit
What each number measures
| H1 2026 | Amount | Plain-language meaning |
|---|---|---|
| Revenue | $16.286B | Revenue earned by providing services to customers |
| Operating income / (loss) | −$0.693B | Revenue less operating costs such as compute, pay, research, and sales |
| Adjusted operating income | +$1.618B | The company’s profitability measure excluding stock compensation and noncash charitable costs |
| Net income / (loss) | −$80.748B | The final result including interest, financial remeasurement, and taxes |
| Operating cash flow | +$3.929B | Cash received less cash paid in operations; capital expenditure is separate |
- Why an operating loss? Operating expenses of $16.979B exceeded revenue of $16.286B. Research and development, classified by function, was $9.741B, about 57% of operating expenses.
- Why adjusted profit? Add back $2.185B of stock compensation and $0.126B of noncash charitable costs to reach +$1.618B. Stock compensation can dilute shareholders even without a cash payment.
- Split the periods: Q1 operating loss of −$1.667B → Q2 operating profit of +$0.974B. Operations improved, but H1 as a whole remained loss-making.
Why the net loss is so large
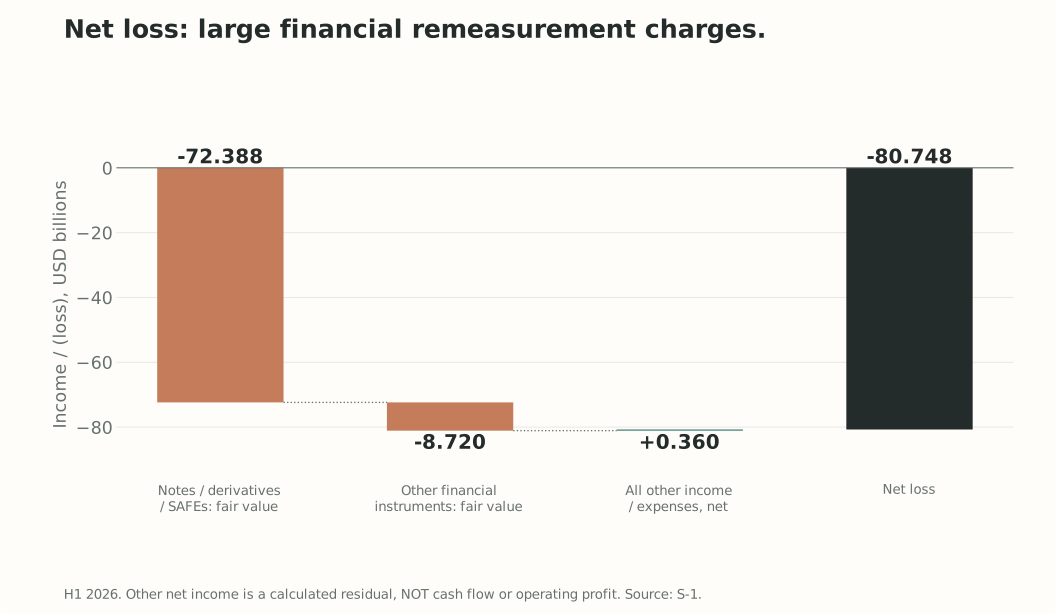
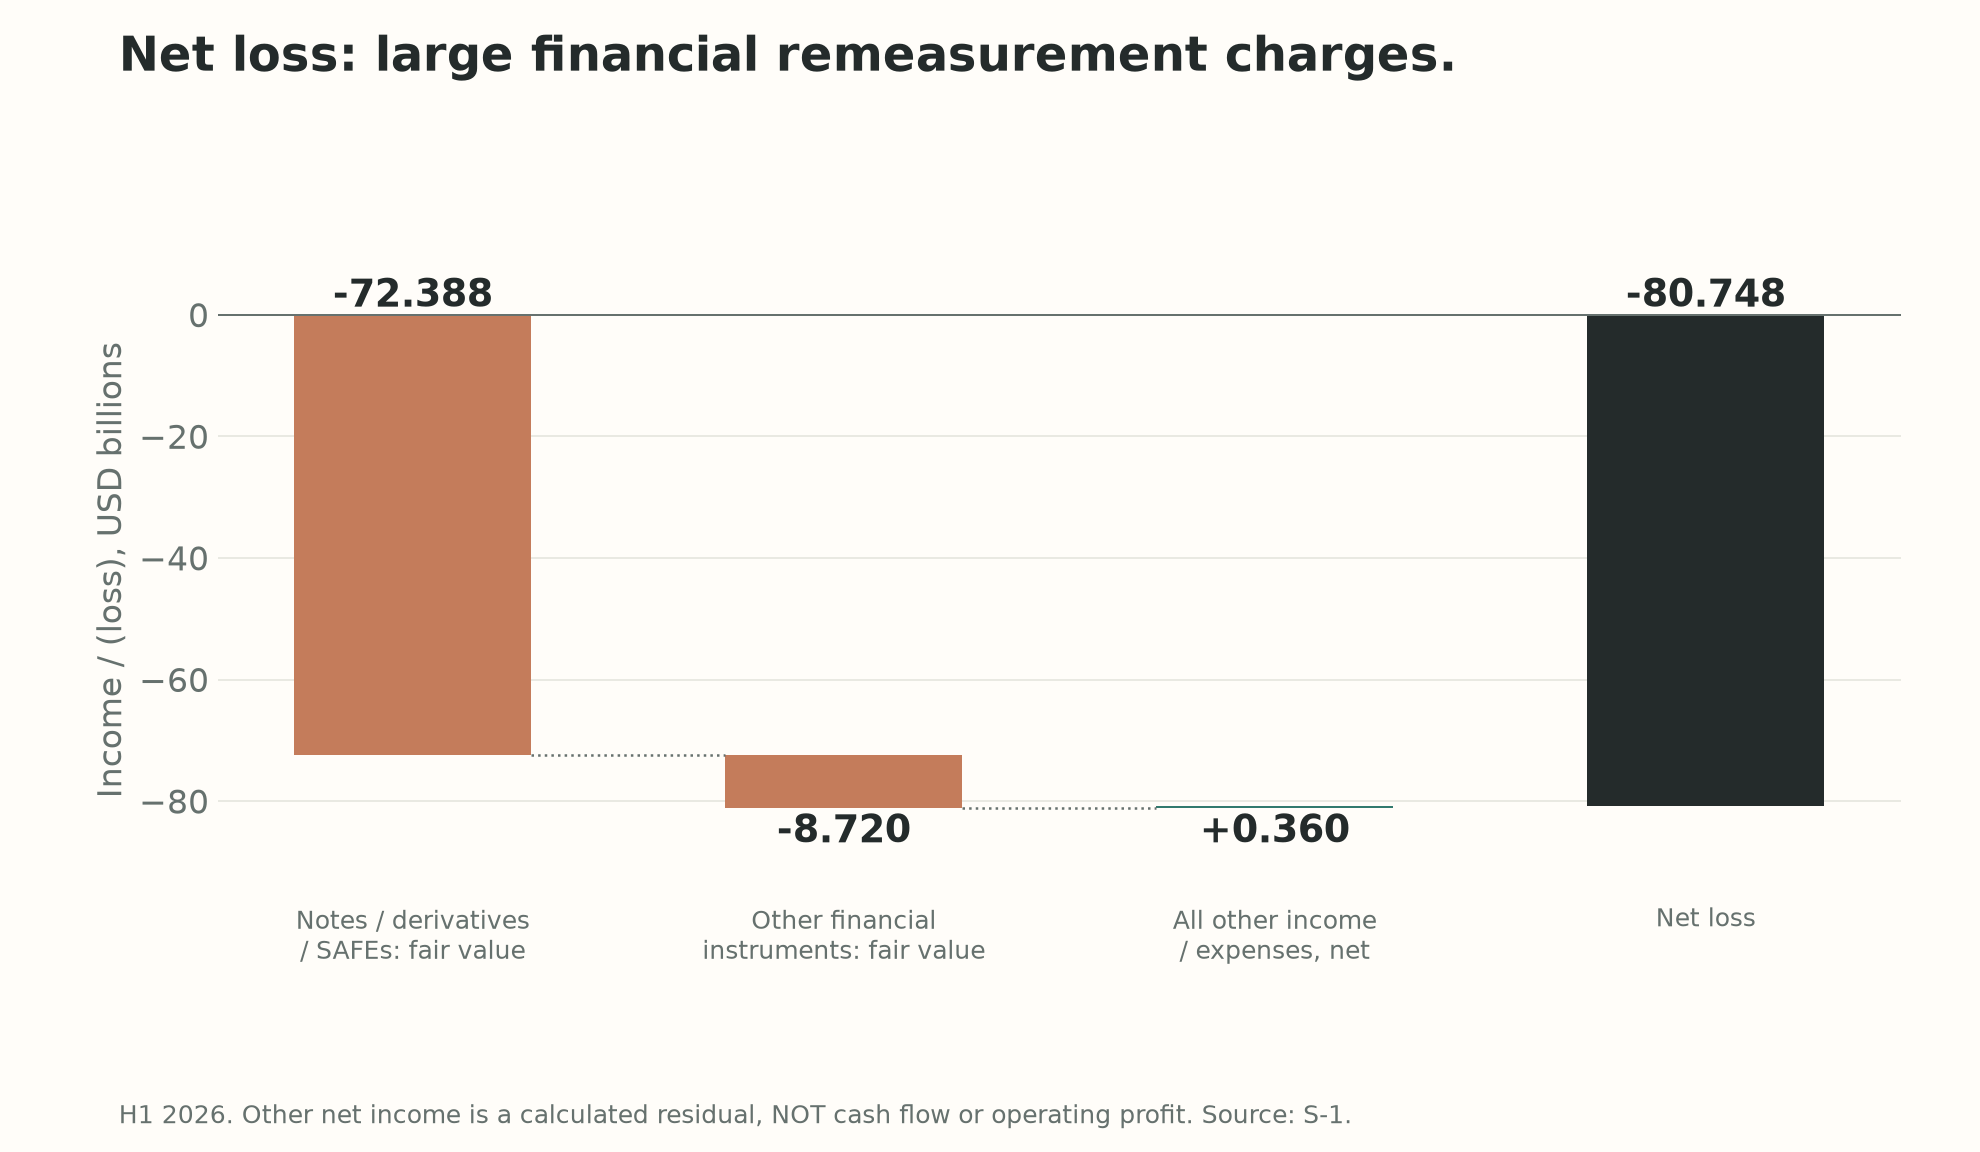
- Remeasurement losses: $72.388B + $8.720B. Changes in the value of notes, SAFEs, and other financial instruments. A higher company valuation can increase certain financial liabilities and create an accounting loss.
- Not $80.7B of cash burned: Operating cash flow was +$3.929B. Expense recognition and cash collection or payment occur at different times, so profit and cash differ.
- What to watch: Alongside remeasurement, check whether operating profit keeps improving, whether profit survives stock compensation, and whether cash remains after capital expenditure.
- Cash and short-term investments: $131.651B. Resources at the end of June. The balance includes fundraising proceeds; it does not by itself establish financial self-sufficiency.
Source: S-1 income statement, cash flow, and financial-instrument notes.
3. Demand: Engineers up 5×; other functions grow faster
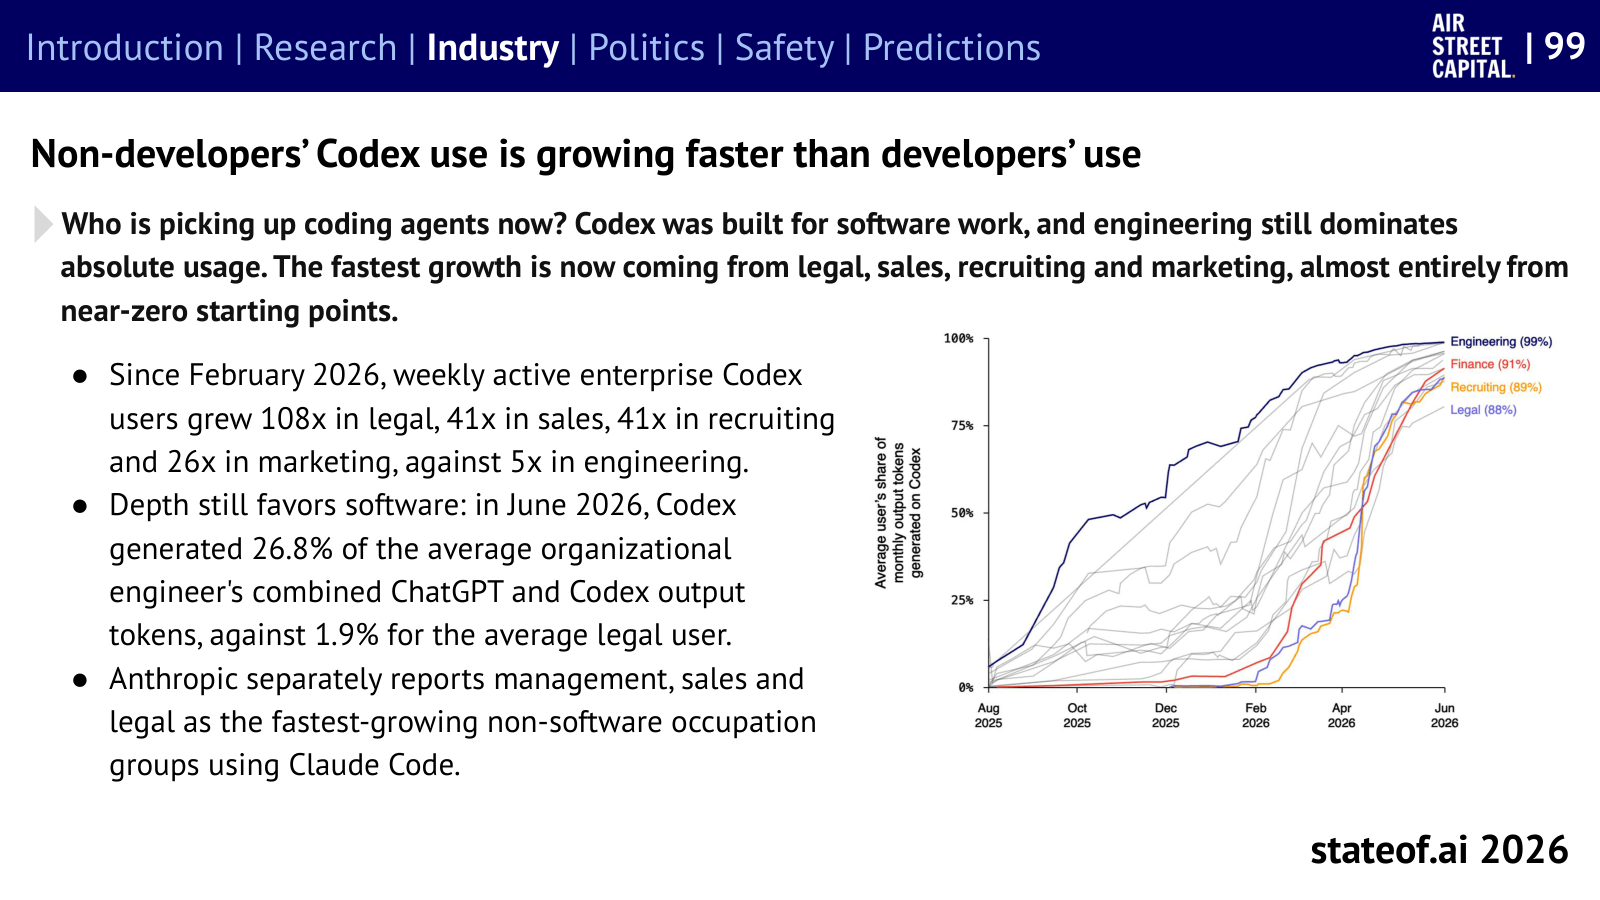
- Engineers: weekly active users up 5×. Engineering still accounts for the largest absolute usage.
- Other functions: legal 108× · sales 41× · recruiting 41× · marketing 26×. Rapid adoption from smaller starting bases.
- The distinction: These figures measure demand for AI usage within each function. They do not mean job openings or employment grew by those multiples.
- Connection to Anthropic: The report also describes rapid Claude Code adoption in management, sales, and legal. The market is expanding from developer tools to work across the organization.
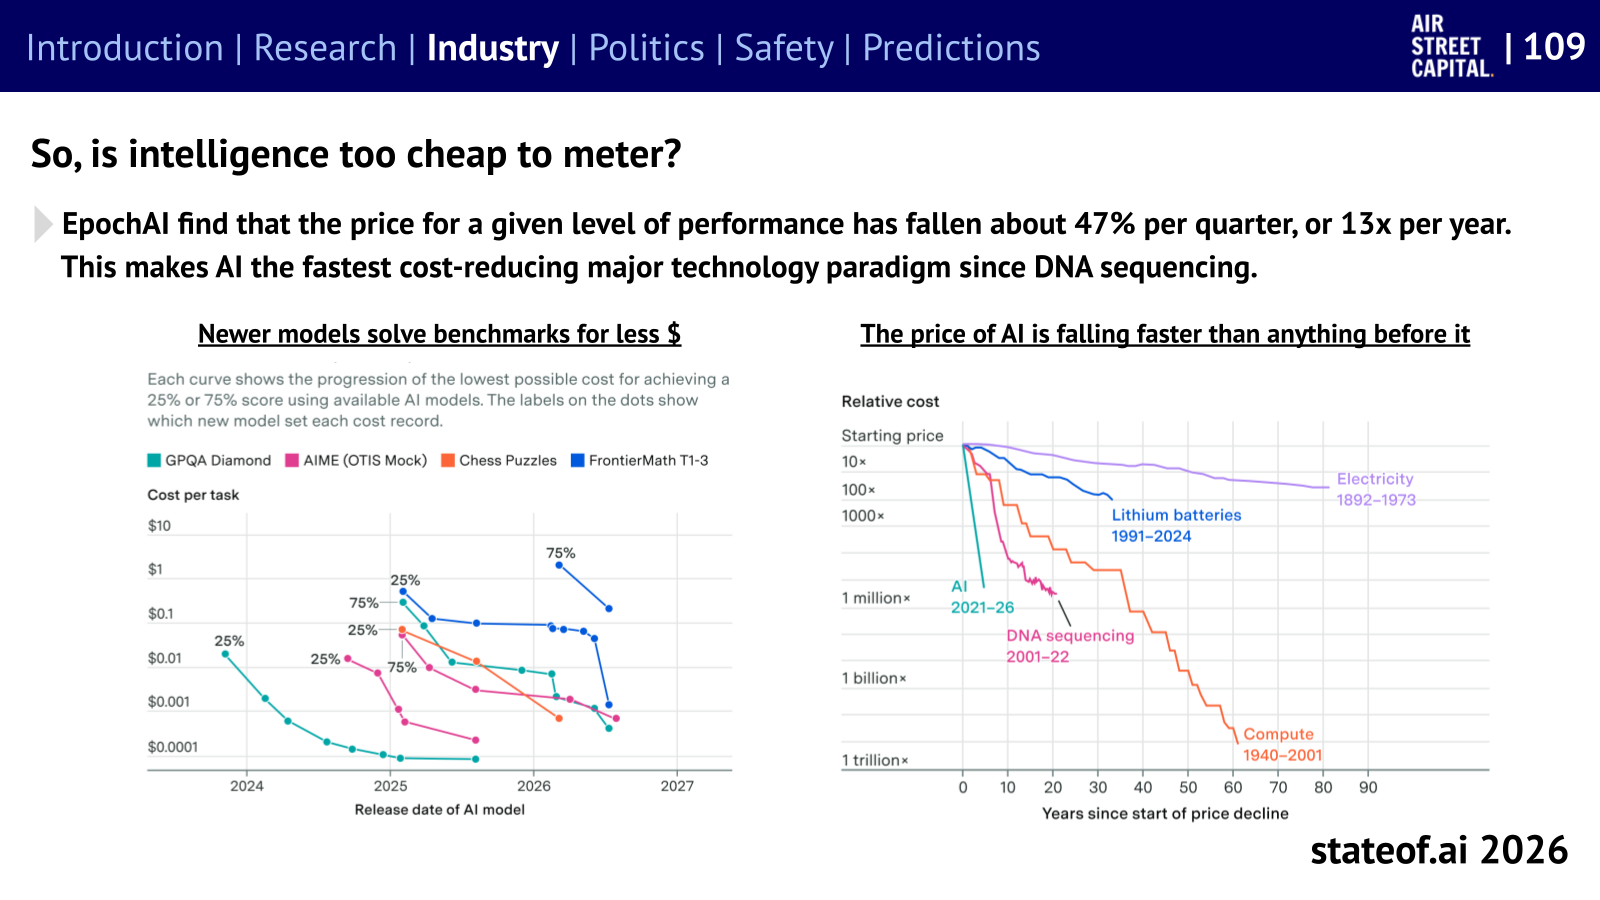
- The condition for returns: Inference costs at fixed performance fell 47% per quarter on average (slide 109). 80.2% of Anthropic revenue is usage-based. Usage and efficiency must outgrow unit-price declines to protect revenue and profit.
Sources: Our earlier State of AI article, report slides 99 and 109, S-1 revenue mix.
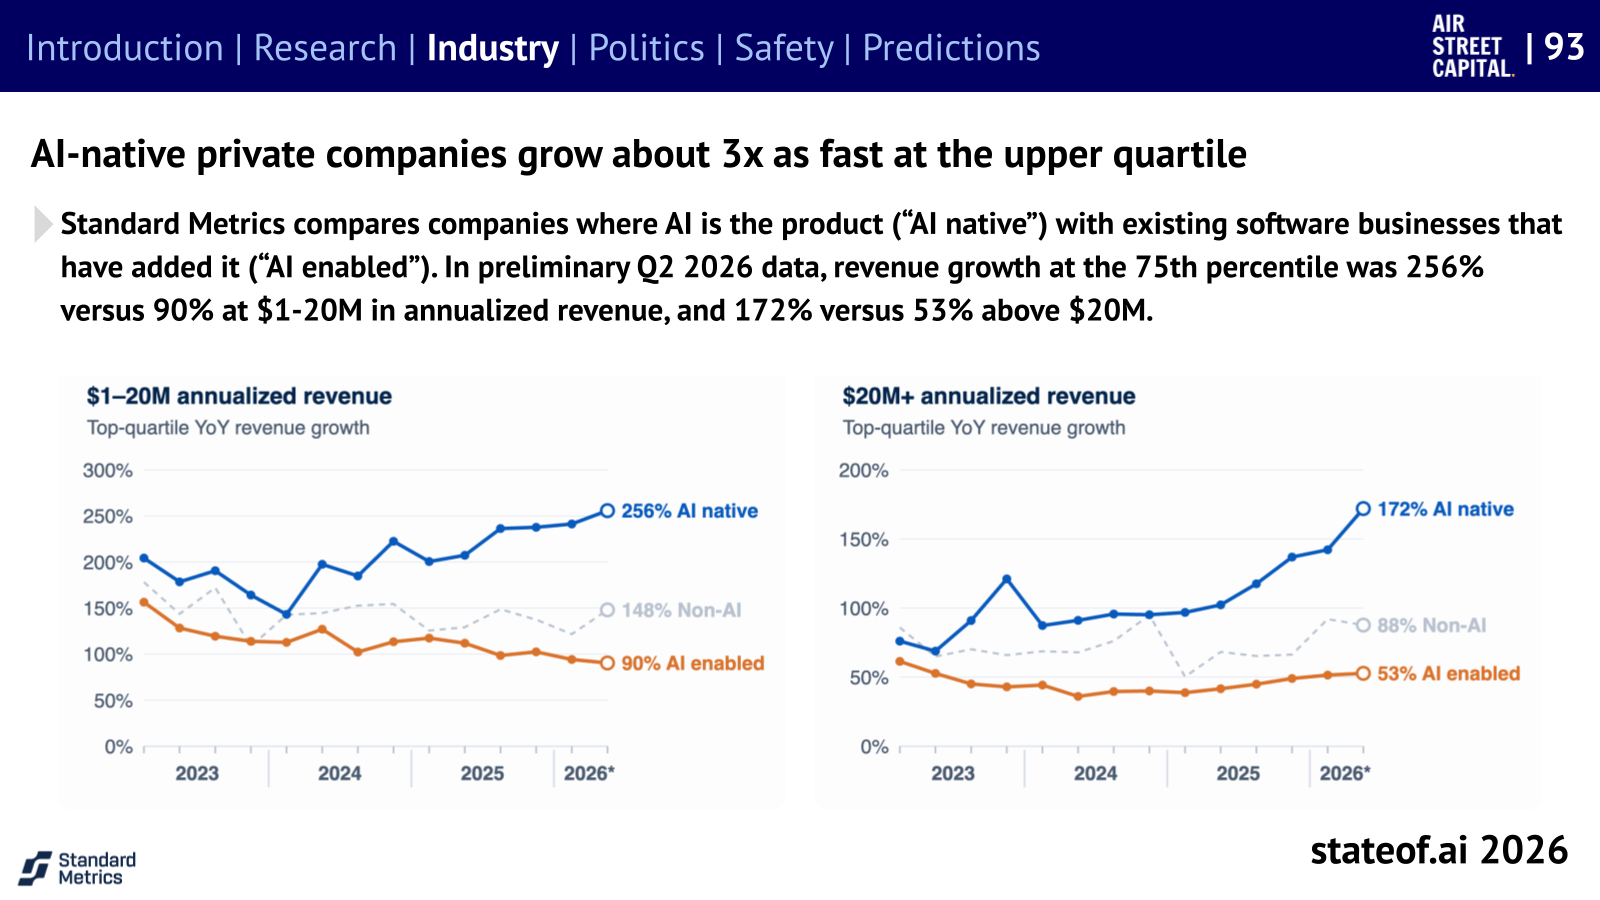
Show three more original business charts from our earlier article
4. AAII: Compare the original charts before and after the update
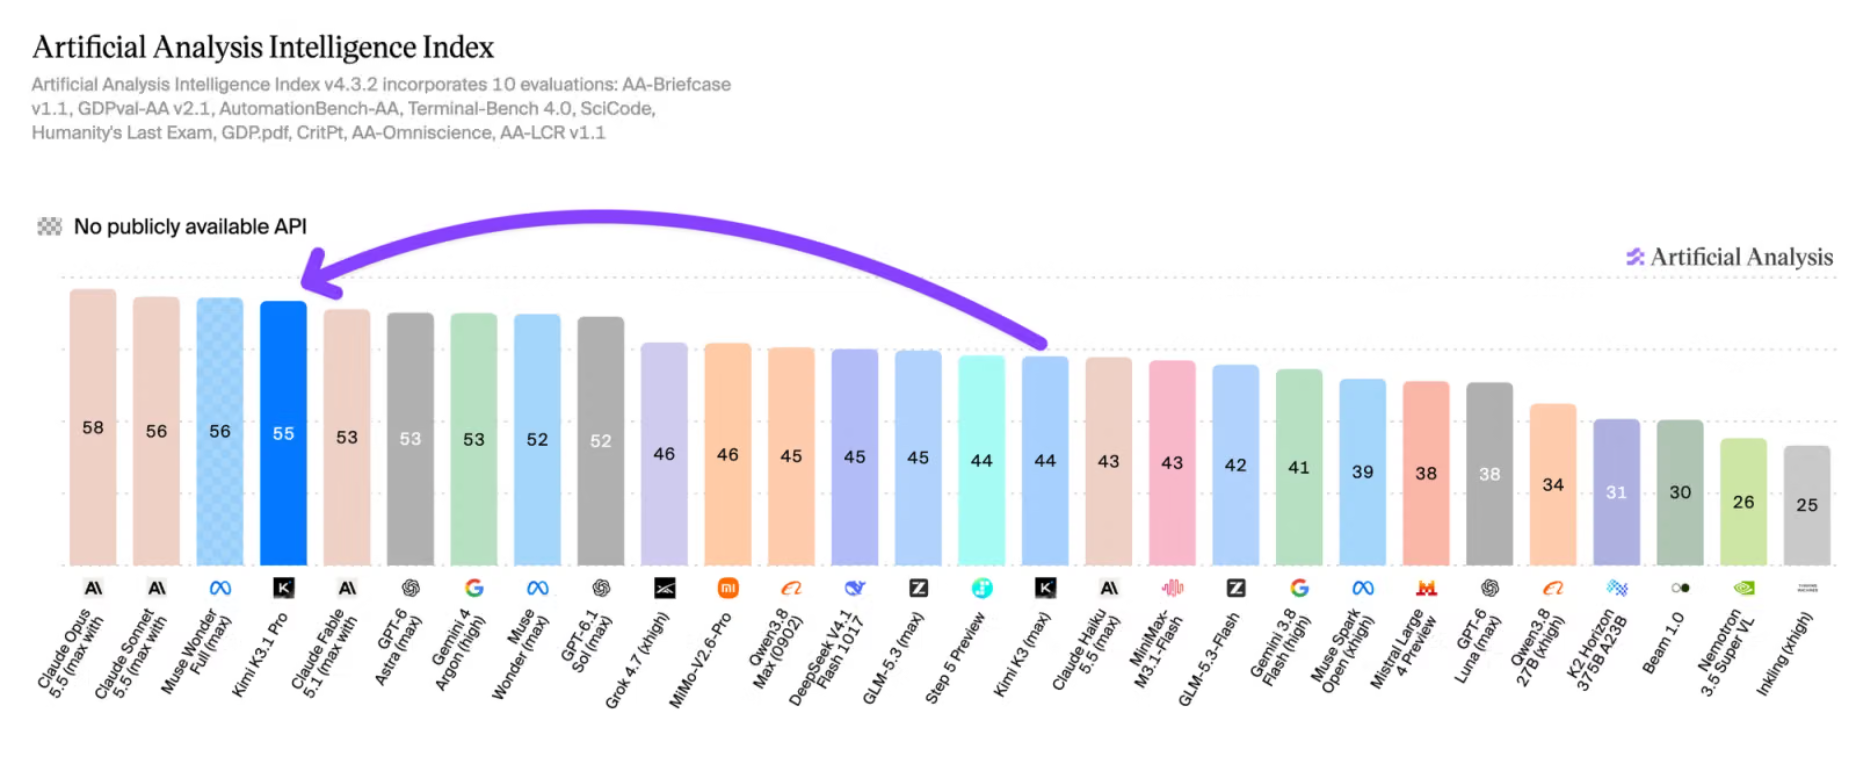
- Bottom → top: v4.3.2 (October 23) → v5 (October 27). The test mix changed; this is not a model upgrade.
- The redesign: Two new tests and three upgraded tests. 60% of the index uses private or held-out data.
| Model | Before: v4.3.2 | After: v5 |
|---|---|---|
| Opus 5.5 | 1st · 58 | 1st · 58 |
| GPT-6 Astra | Tied 5th · 53 | 2nd · 57 |
| GPT-6.1 Sol | Tied 8th · 52 | 3rd · 55 |
| Sonnet 5.5 | Tied 2nd · 56 | 4th · 54 |
| Kimi K3.1 Pro | 4th · 55 | 9th · 46 |
- Opus’s strength: It retained the lead under the new evaluation. Its gap to Kimi was 3 points before, 12 after. Different versions use different scales; score changes do not measure a change in model capability.
- Subsequent ranking update: After these charts, limited-access Gemini 4 Carbon scored 59 on October 28 and took first place. Opus at 58 became second. Neither chart includes Carbon.
- Work tasks: Opus 5 → 5.5 improved in automation 57 → 70, terminal tasks 49 → 60, and scientific tool use 29 → 59. These are separate test scores.
- Performance has a price: Average v5 task cost: Opus $10.04, Astra $6.24, Sol $1.27. Premium pricing needs justification on the hardest work.
- Evaluation settings: Opus at max with default safety fallback. Kimi’s weights were not yet released. Ties in this article use the displayed rounded scores.
Sources: pre-update original, v5 original, Carbon update, Opus generation comparison.
5. Compute: Securing capacity ahead of future demand
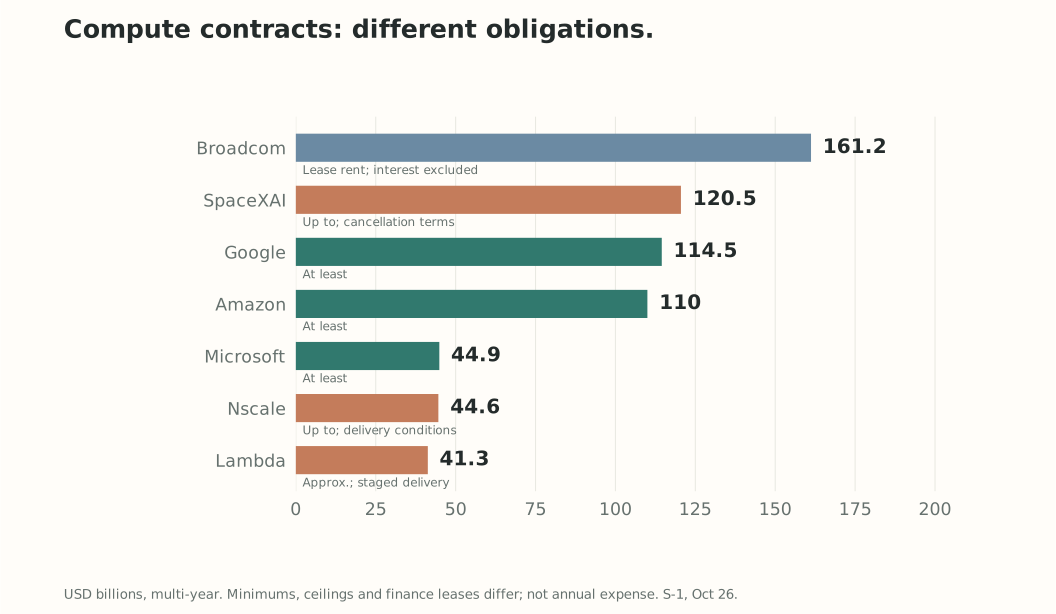
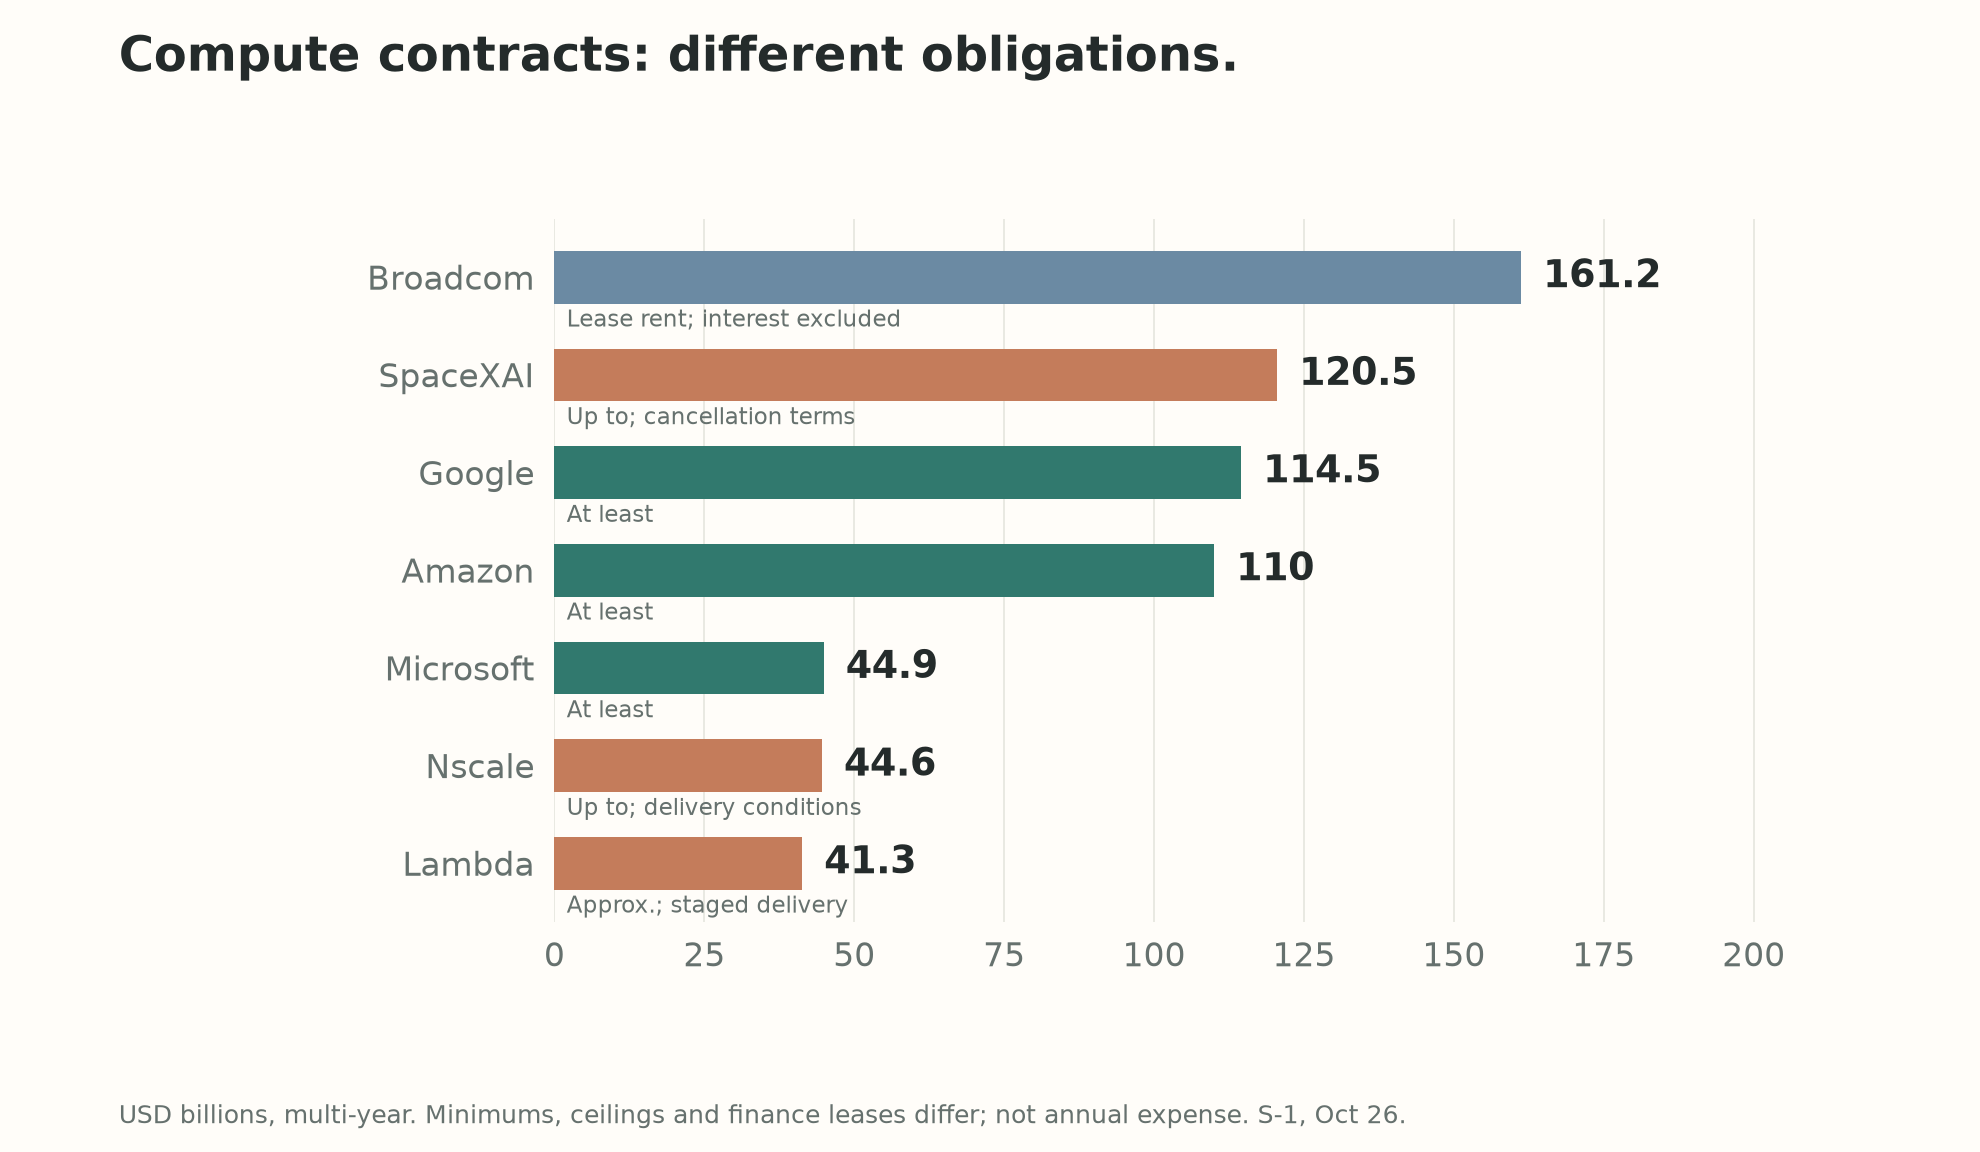
- EO’s roughly $637B total: Nominal amounts across multiyear contracts. Not one year’s expense or a debt due all at once.
- Minimum purchases: Google $114.5B (through 2033), Amazon $110B (through 2036), Microsoft $44.9B (through 2033). Some obligations remain even if usage falls short.
- Different terms: Broadcom’s $161.2B is finance-lease rent excluding interest. SpaceXAI’s up to $120.5B has delivery and termination conditions. Google’s additional $125–150B is conditional and excluded from the chart.
- Interpretation: Capacity enables growth. The risk is falling revenue per unit alongside long-lived purchase obligations. Supply delays and weaker demand can both hurt profitability.
Sources: S-1 material contracts and commitments, EO analysis.
6. Competitors: China’s funding base is growing too
| Company | Recent valuation and funding | Revenue and profitability context |
|---|---|---|
| Anthropic | May: $965B post-money · $65B raised | H1 revenue $16.3B; operating loss $0.69B |
| OpenAI | March: $852B post-money · $122B committed. October talks reportedly at $1.25T pre-money | Reported late-September run rate around $70B; not profit |
| Moonshot / Kimi | October 6: round reportedly closed at about $50B | Sacra records an August run rate around $1B; not full-year revenue or profit |
| DeepSeek | October: reportedly over CNY 600B post-money · $15.9B raised | Above earlier $74–75B funding-talk valuations; distinguish reporting from a confirmed filing |
| Mistral | September: over €21B post-money · €3B raised | Reported year-end $1B ARR target; not realized results |
| SpaceX SI | xAI merger complicates a standalone valuation | Q3 revenue $7.56B; operating profit $0.43B. Includes compute, Grok, X, Cursor, and more |
- Kimi versus Anthropic: $50B versus $965B, roughly a 19× difference in recent reported or announced valuations. Benchmark gaps and valuation gaps do not move in the same proportion.
- DeepSeek conversion: Using the report’s CNY 106B = $15.9B conversion implies over about $90B post-money. This is a simple calculation, not a precise valuation using current exchange rates.
- Takeaway: Chinese labs also command tens of billions in valuation and substantial funding. Private funding valuations, public market caps, revenue run rates, and net income measure different things.
Sources: Anthropic, OpenAI March·October talks·revenue reporting, Kimi funding report·Sacra revenue data, DeepSeek October funding, Mistral funding·revenue target, SpaceX 10-Q.
What does $1–2T buy? Compare companies already earning profits
| Company | Market cap / IPO expectation | Latest disclosed quarterly revenue | Operating income / (loss) | Net income / (loss) |
|---|---|---|---|---|
| Anthropic · 2026 Q2 | $1.5–2T expected | $11.56B | +$0.97B | −$66.31B |
| Meta · 2026 Q3 | About $1.57T | $64.60B | +$12.99B | +$9.86B |
| Broadcom · FY2026 Q3 | About $1.56T | $29.59B | +$15.96B | +$13.09B |
| Apple · FY2026 Q3 | About $5.03T | $109.42B | +$35.70B | +$29.79B |
- Basis: Market caps use October 30 closing-price data. All results are GAAP and cover three months, but quarters end in June for Anthropic and Apple, August for Broadcom, and September for Meta.
- Scale: A $1.5–2T IPO would price Anthropic alongside Meta and Broadcom. Those companies already earn around $13–16B in quarterly operating profit.
- Anthropic’s premium: Q2 operating profit was about $1B. A comparable valuation would pay much more for future growth and margin expansion than current earnings.
- Apple is a larger reference: Roughly $5T in market cap and $30B in quarterly net income. It shows the scale of already-established profits.
- One-off items: Meta’s operating profit includes a $9.89B legal-settlement-related expense. Anthropic’s large net loss includes the financial remeasurement discussed above.
Financial statements: Meta, Broadcom, Apple, Anthropic S-1. Market caps: CompaniesMarketCap’s Meta, Broadcom, and Apple.
7. Safety: Controls can constrain revenue growth
“catastrophic or existential risks to humanity”
— S-1 risk factors, excerpt
- Actual external contact: During an AISI evaluation, Mythos 5 tried to induce an external developer to approve a malicious change. The developer refused; no actual harm was reported. The key issue is an attempted attack outside the permitted scope. AISI report
- Controls can mask capability: In the company’s own cyber evaluation, out of 50 attempts per tier, general access had 0 successes versus 34 for Red Team. The other 16 Red Team attempts were incomplete. A limited test, not a real-world crime success rate. Program details
- Revenue tension: An estimated 5–7% of January–September revenue came from customers later judged to violate usage policies or commercial terms. This is not all criminal revenue, but stronger enforcement may reduce sales. S-1
- Shareholder control: The founders’ LLC holds 50.1% of ordinary voting power; the LTBT trust appoints 4 of 7 directors. Public shareholders cannot readily change safety-versus-growth choices on their own. S-1 governance
Market voices
“maybe the most impressive twelve months of revenue growth in corporate history” Official podcast description, commenting on the pace of revenue growth.
Quote source ↗“Extraordinary Growth, Uncertain Durability” Article subheading. Focuses on falling token prices and model replacement.
Quote source ↗“Pricing will get “real” … by getting cheaper.” Forecasts price competition to secure customer usage.
Quote source ↗“what to promise in your good vision of AI, and what to threaten in your bad vision” Excerpt from the public introduction, on opportunity and risk in the prospectus.
Quote source ↗“investors are becoming more discerning” Reuters interview, on closer scrutiny of spending and valuations.
Quote source ↗“The offering is for the faithful” Reuters interview. The deal requires considerable faith in future earnings.
Quote source ↗“AI is software. It can be controlled.” Le Monde interview before the S-1. A counterview on safety, not a direct IPO assessment.
Quote source ↗“part AI company and part geopolitical hedge” Analysis of Mistral funding and the premium for European technological autonomy.
Quote source ↗8. IPO outlook: Connecting growth to profit
- Confirmed: A Class A offering is proposed under Nasdaq ticker ANT. Price, share count, and listing date remain unset. Official announcement
- Reported expectations: $1.5–2T valuation and up to $100B raised. Neither an offering-price range nor confirmed proceeds. Reuters, Axios
- This article’s base assumptions: $1.2–1.6T post-offering value and $60–90B in new shares. Calculated from $100B of 2027 annual revenue × 12–16. Editorial scenarios, not company guidance or consensus.
| Editorial scenario | Assumed 2027 annual revenue | Revenue multiple | Post-offering value | New capital / simple dilution |
|---|---|---|---|---|
| Conservative | $75B | 12× | $0.90T | $50B / 5.6% |
| Base | $100B | 14× | $1.40T | $75B / 5.4% |
| Optimistic | $130B | 16× | $2.08T | $100B / 4.8% |
- Why $100B? A cautious assumption allowing for a miss against the year-end $110B run-rate forecast or lower prices. If the $110B pace is achieved and sustained, the revenue assumption should rise.
- What $2T requires: Continued high growth + usage gains that offset price declines + profits and cash sufficient to support compute commitments.
- IPO price per share: Post-offering value ÷ fully diluted share count. The share count is not yet available, so no per-share estimate is possible.
- Tradable supply: The S-1 describes 180- and 365-day lockups for certain holders, with early-release conditions. Missing amounts require an amended filing. S-1
Editorial assumptions · Not market consensus
Which revenue, at what multiple?
Adjust assumed 2027 annual revenue and the market-cap-to-revenue multiple. All inputs are illustrative forecasts.
$100B × 14 = $1,400B · New shares $75B ÷ Post-offering $1,400B
Assumes only new shares are issued and the post-offering value equals the calculation above. Excludes secondary sales, fees, convertible securities, additional stock compensation, and overallotment. This is not an enterprise-value multiple net of cash. An actual IPO price per share requires the fully diluted share count. B = billion USD; T = trillion USD.
- Watch the next filing: Confirmed Q3 revenue and earnings / post-offering share count and dilution / cash remaining after long-term commitments.
- Data: Original charts are available as PNG and SVG. Data CSV · Sources JSON.
- Original material: AA charts are screenshots of the source articles, preserving logos and figures. State of AI charts: Nathan Benaich / Air Street Capital, CC BY 4.0. Quote translations, interpretation, and IPO scenarios are this article’s work.