State of AI 2026: Capability, Agents, Infrastructure, Business, and AI Sovereignty
How much better have models become—and how far does that capability translate into completed work, revenue, and national competitiveness? This guide draws on Nathan Benaich and Air Street Capital’s State of AI Report 2026 to organize five stories for an episode.
How to read this guide: The figures reflect the report’s snapshot; they are not live rankings or prices as of October 23, 2026. Original charts appear without modification, and you can click an image to enlarge it. The links below each figure open the corresponding PDF page. “Discussion question” indicates this guide’s editorial interpretation.
Five Stories at a Glance
| Theme | The figure to remember | The episode’s question |
|---|---|---|
| 1. AI progress | Scientific workflows: 87.9/100 partial credit, 20.6% completion | Does a high score mean the work is finished? |
| 2. AI agents | Same model, different setup: 52.5% → 65.5% | What can we change before switching models? |
| 3. Compute & infrastructure | Miners’ AI power contracts: about 5.6 GW; live capacity: about 0.9 GW | How much announced capacity is actually usable? |
| 4. AI in business | OpenAI and Anthropic: about $105B in combined annualized revenue | Why are the market and spending growing as costs fall? |
| 5. Policy & geopolitics | About $138B pledged to selected sovereign AI programs | Does a domestic data center deliver AI sovereignty? |
1. AI progress — What a Ranking Measures Matters More
Intelligence rankings and people’s preferred answers have different leaders
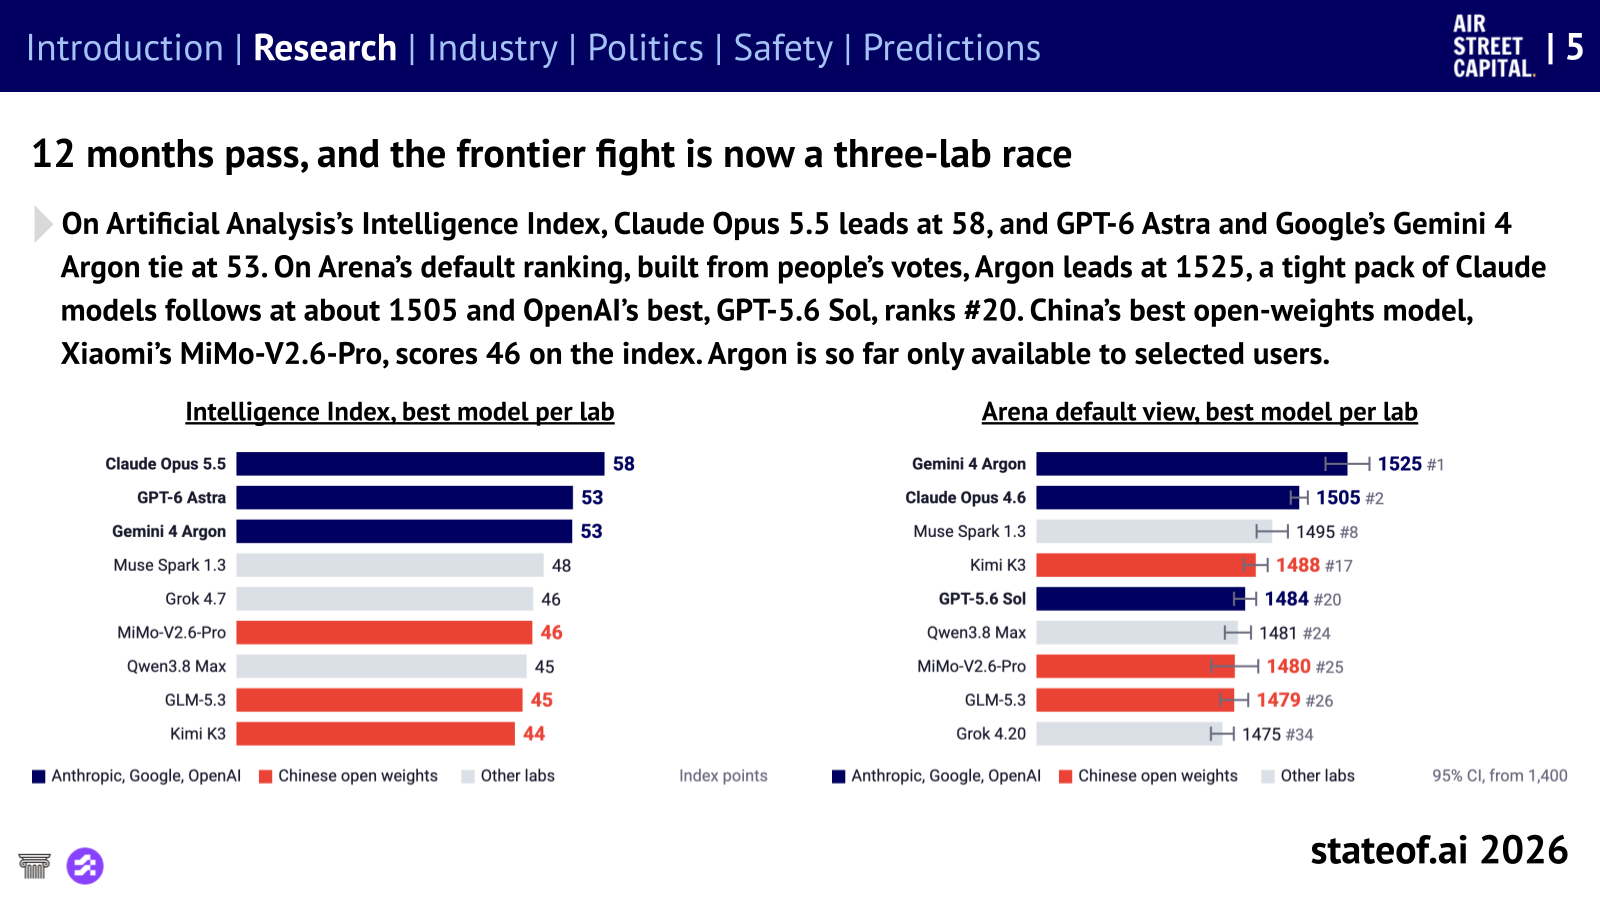
- The report describes a three-way race between Anthropic, OpenAI, and Google. Claude Opus 5.5 scores 58 on Artificial Analysis, while GPT-6 Astra and Gemini 4 Argon each score 53.
- The leader changes when people’s preferences are the measure. Argon leads Arena at 1525, with Claude models clustered around 1505. At the time of the report, Argon was available only to selected users.
Established tests are saturating, while partial credit can obscure completion
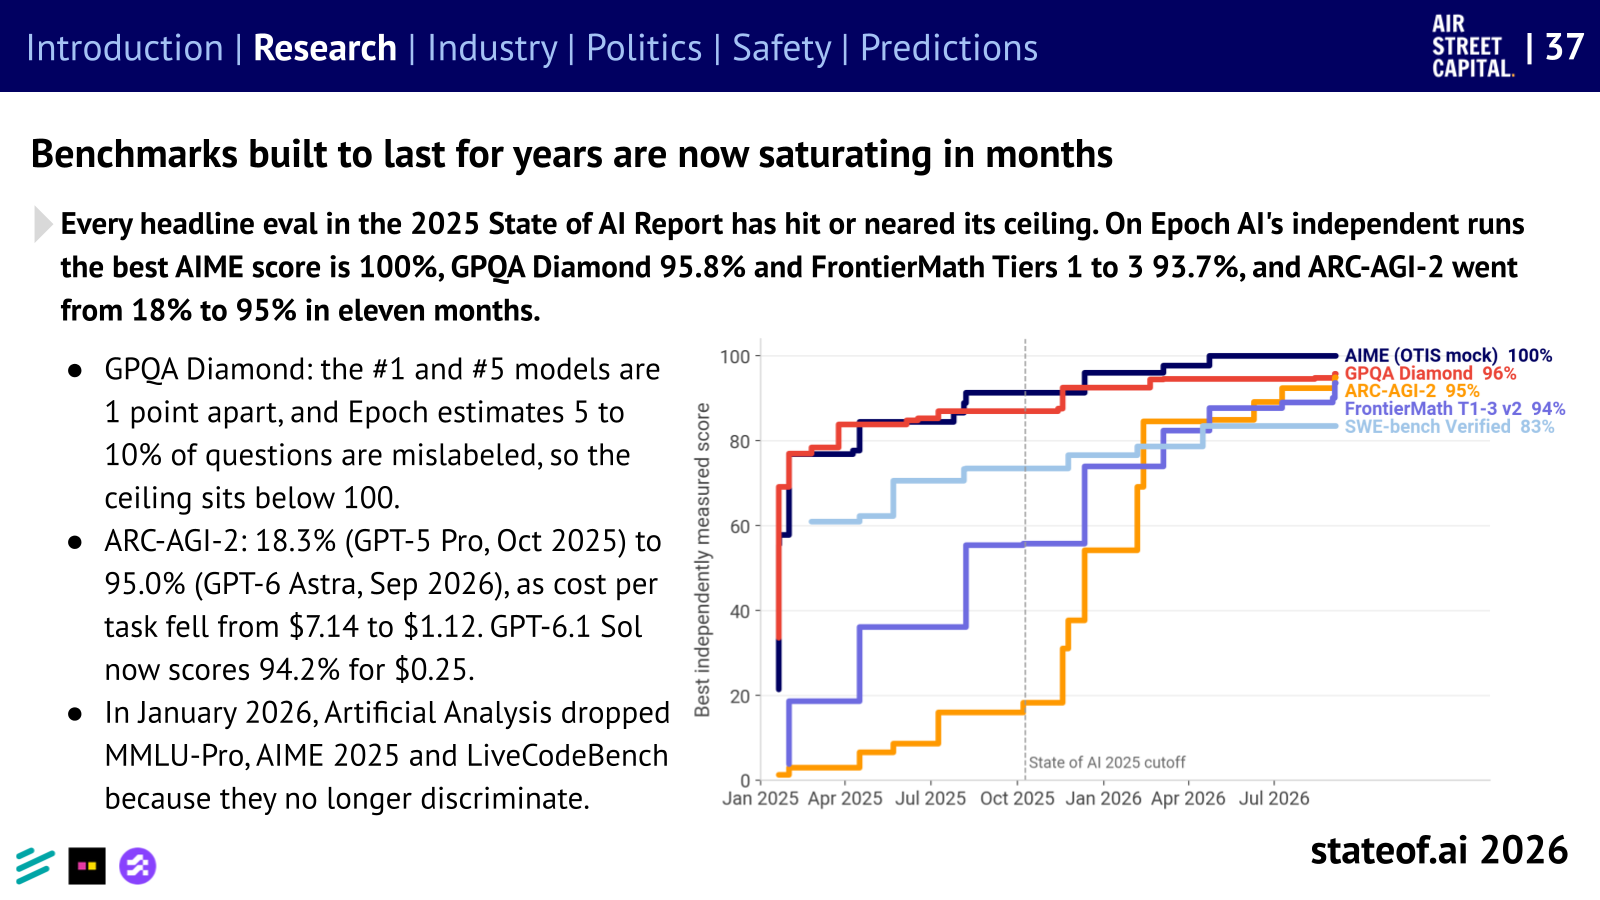
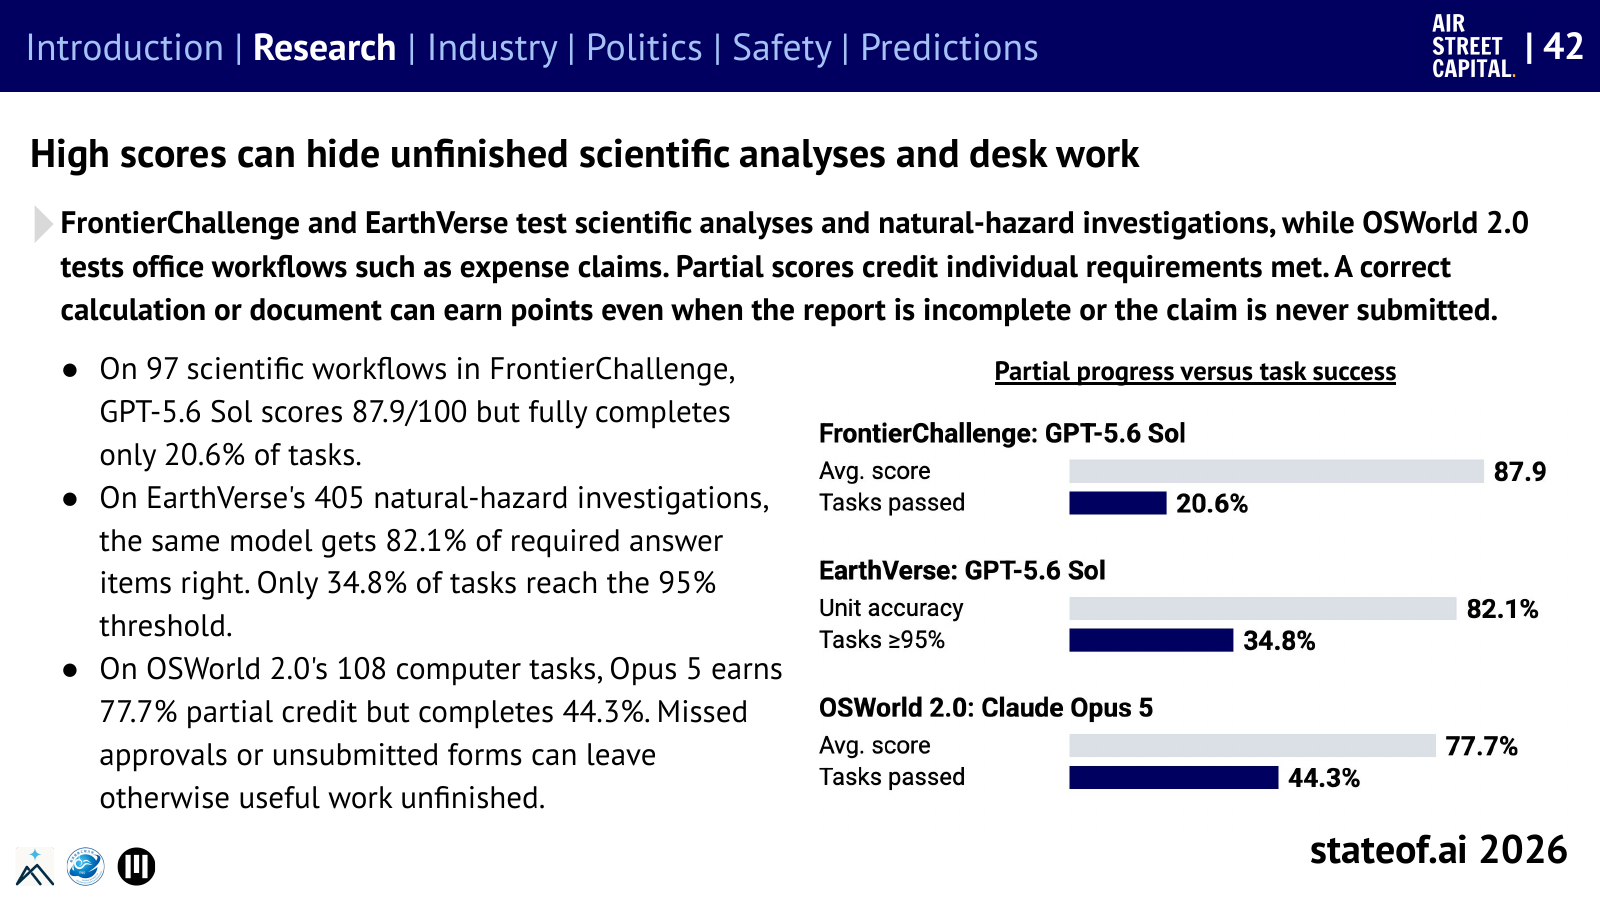
- Across 97 scientific workflows in FrontierChallenge, GPT-5.6 Sol scored 87.9/100 for meeting individual requirements but fully completed 20.6% of the tasks.
- Across 108 computer tasks in OSWorld 2.0, Opus 5 earned 77.7% partial credit and completed 44.3%. A missed approval or an unsubmitted form can leave otherwise useful work unfinished.
- METR’s “50% time horizon” is the human-expert duration of tasks an agent can complete with a 50% probability. It does not mean an agent can safely be left unattended for that length of time. The evaluation discussed in the report includes only five tasks taking humans more than 16 hours, making estimates at the upper end unreliable.
Source: slide 37 · PDF page 38 · Slides 42–43 begin at PDF page 43
AI is helping build AI, while choosing research directions remains a challenge
- Anthropic’s internal metric: Claude’s share of measured model R&D rose from under 1% in February 2026 to 26% in August. Humans set the tasks and supervise execution.
- Running experiments and choosing good research are different capabilities. In the report’s evaluation using unpublished NeurIPS paper tasks, agents received six days, GPUs, and $3,000 in API credits. Opus 4.8 completed the engineering, but its two papers received rejection scores of 2/6 and 1/6.
Anthropic’s original R&D measurement analysis · Research task evaluation: slide 17 · PDF page 18
Discussion question: How does our organization distinguish a plausible intermediate result from work that has passed final review?
2. AI agents — Tools and Context Change What the Same Model Can Do
Holding the model fixed, the success rate rose by 13 percentage points
A harness is the software around a model that supplies tools, manages context and task state, and connects failures to feedback and retries.
| GLM-5.1 agent setup | Tasks resolved |
|---|---|
| Minimal | 52.5% |
| Improved | 56.5% |
| Full | 65.5% |
- The study held model weights fixed and changed only tools, context, and feedback. It used 100 SWE-bench Verified tasks, reporting mean pass@1 across two runs.
- The increase from 52.5% to 65.5% is 13 percentage points, or about 25% relative to the starting score. It does not guarantee the same improvement on every kind of work.
Original study · Table 2 · Slide 7 · PDF page 8
Choosing the right setup for the problem
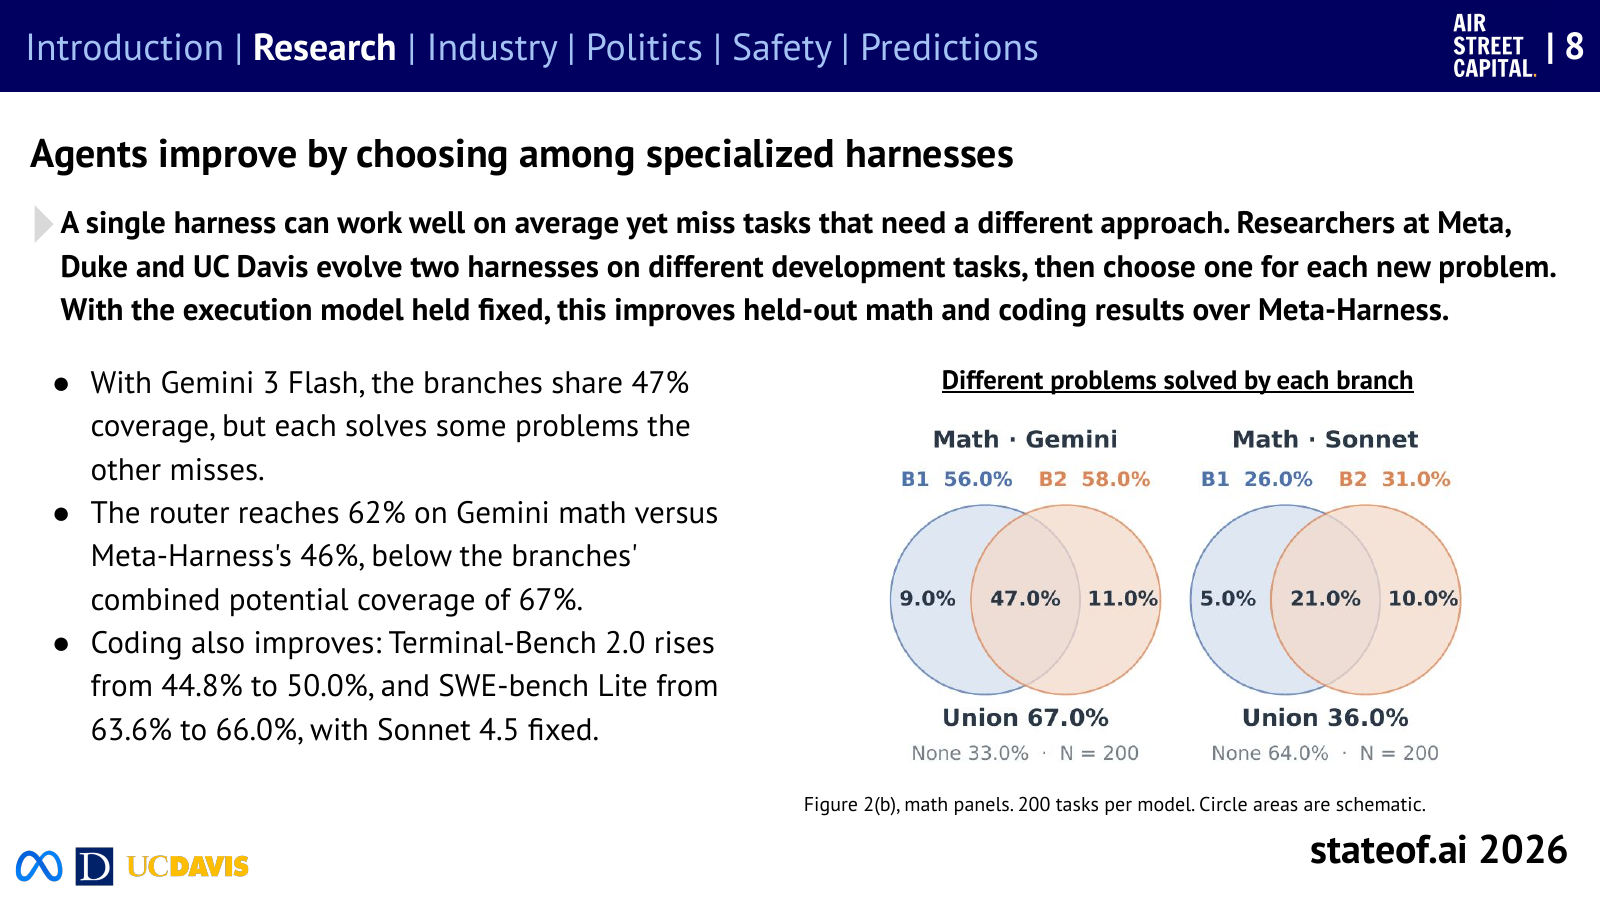
- In a math evaluation with Gemini 3 Flash held fixed, a router choosing between specialized harnesses reached 62%, versus 46% for Meta-Harness. Either branch could solve 67% of the problems in total, leaving room to improve the routing decision.
- Memory and skills let an agent carry information from earlier work into later tasks without retraining the model. Storing records alone does not establish learning; the benefit needs to be checked on repeated tasks and verifiable outcomes.
- As models improve, existing scaffolding needs to be retested. The report describes Claude Code removing 80% of its system prompt for advanced models without a measurable decline on coding evaluations.
Source: slide 8 · PDF page 9 · Slide 10 · PDF page 11 · Slide 14 · PDF page 15
Adoption is spreading beyond developers, while long-term judgment remains a separate challenge
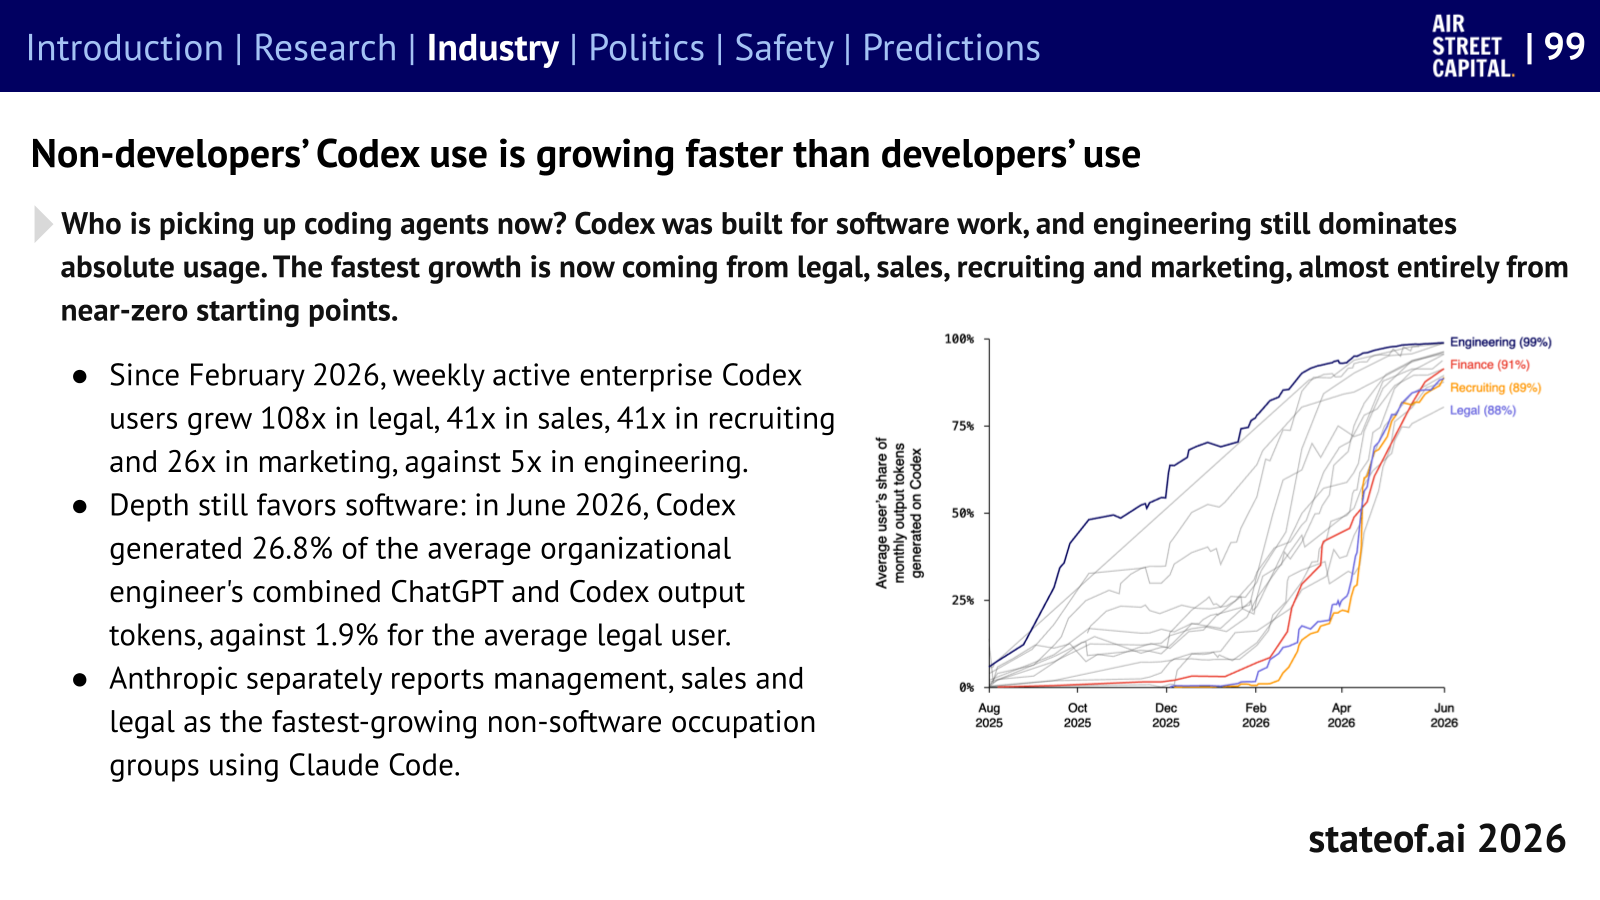
- OpenAI’s adoption study found rapid growth from small starting points among non-developers, including legal, sales, recruiting, and marketing. A higher growth multiple does not establish a larger current user base.
- In KellyBench’s simulated betting market, all 12 models lost money on average across five runs, and six went bankrupt at least once.
- In E-CommerceBench’s simulated stores, 16 of 18 models showed no clear improvement in bargaining on repeat purchases. Performance needs to include fraud exposure, losses, and learning from experience alongside returns. Neither simulation measures actual business profitability.
OpenAI adoption study · Slide 99 · PDF page 100 · Long-running evaluations: slides 44–45 begin at PDF page 45
Discussion question: Before paying for a more expensive model, which should we change first: tools, task context, review, or retries?
3. Compute & infrastructure — Turning Investment Commitments into Usable Capacity
$733B in annual capital expenditure, with different scopes in the US and Europe
- Four US hyperscalers guided to about $733B in total capital expenditure for 2026. The entire amount is not dedicated to AI.
- The EU AI Gigafactories initiative has an initial €1B contribution, within a program seeking up to €10B in public funding and at least €20B in private funding. It does not represent all European AI investment and has a different scope from US companies’ total annual CAPEX.
- NVIDIA’s partnership with six financial institutions aims to mobilize more than $500B for AI infrastructure. That is a target, rather than cash already deployed or completed data centers.
Report slide 134 · PDF page 135 · European Commission gigafactories call
About 0.9 GW is live against 5.6 GW of contracted power
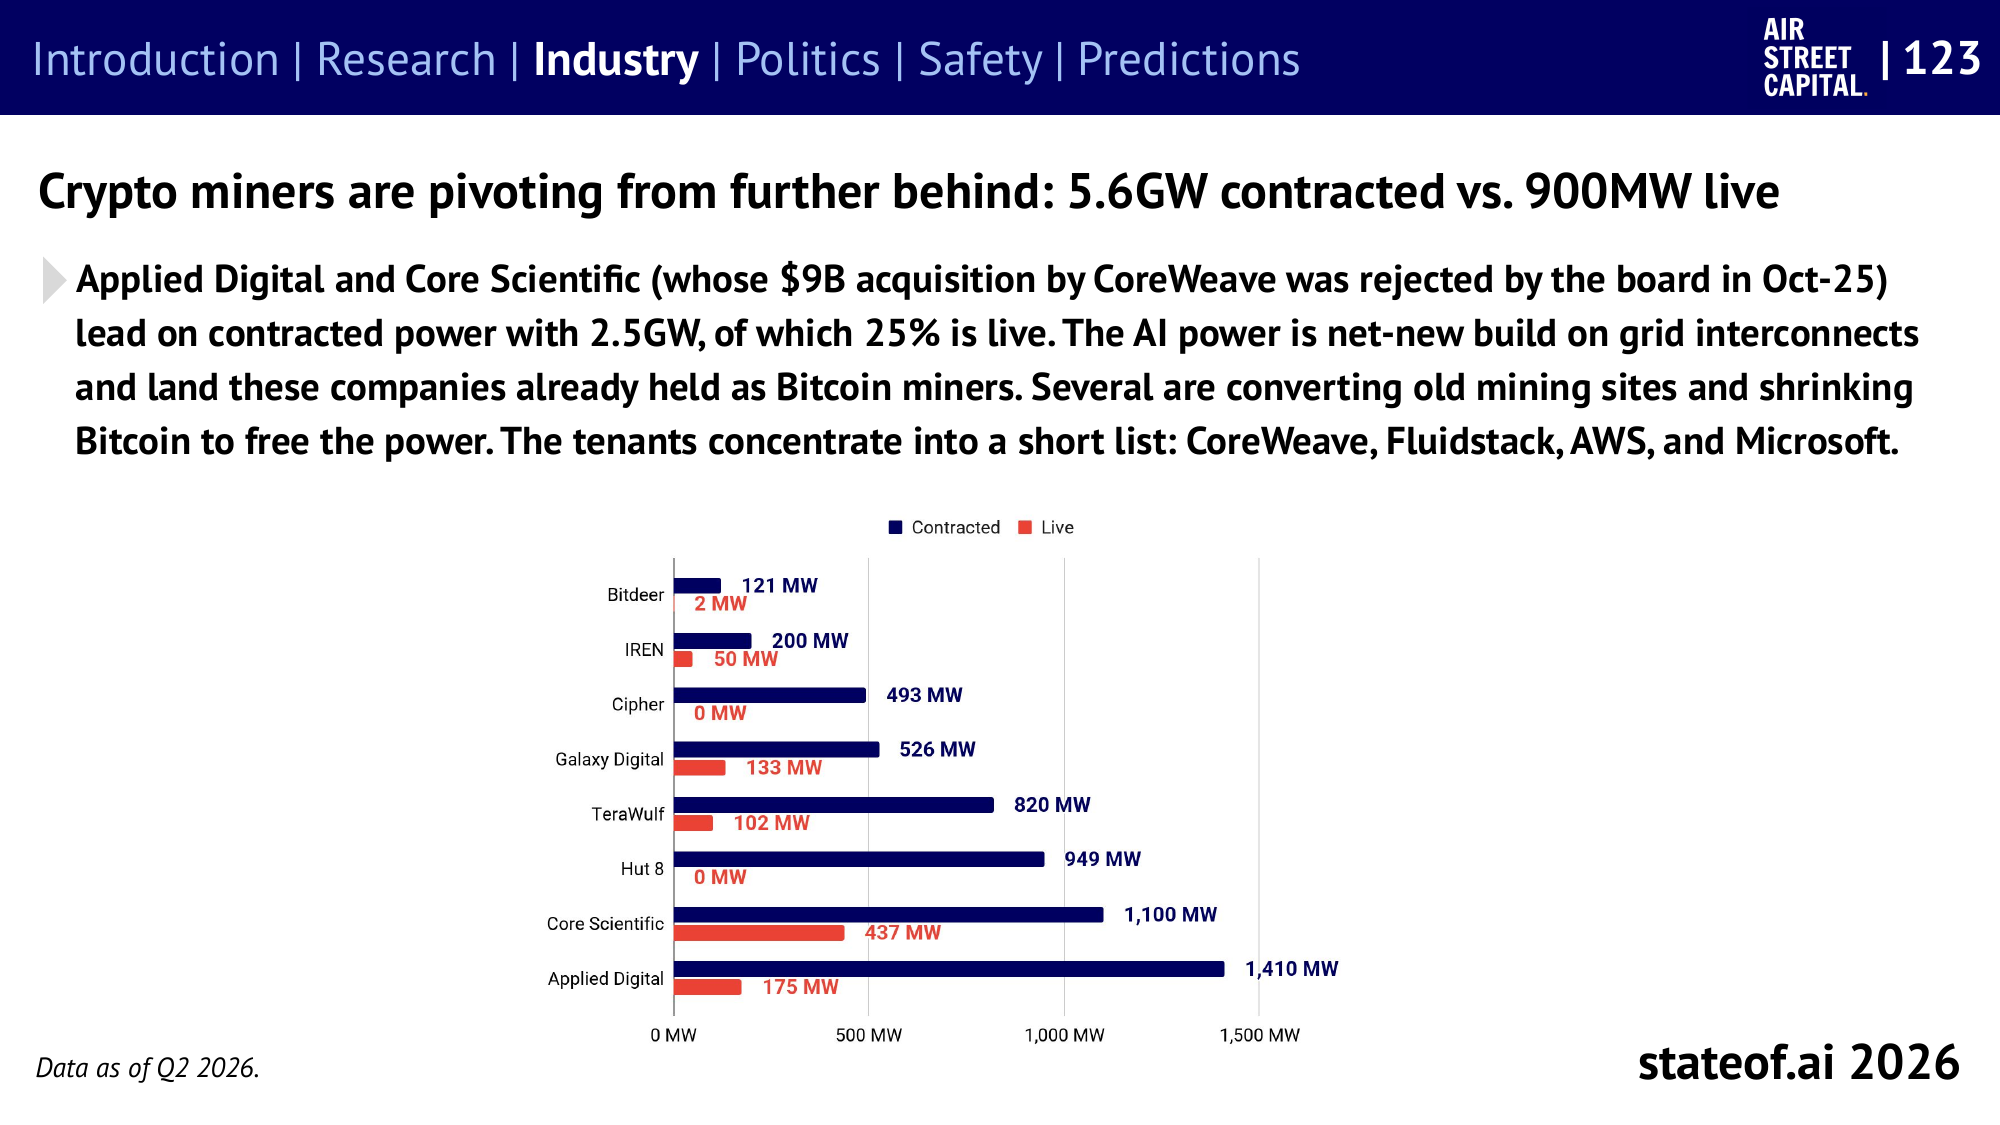
- Power contracts → permits → construction → power delivery → equipment installation: customers can run workloads only once the chain is complete. Existing mining sites and grid connections still require additional construction for AI facilities.
- CoreWeave is a separate example: it reported 1.5 GW of live power at the end of Q2 and 4.2 GW of contracted power as of August 11. The dates differ, and the figures cannot be added together as total live capacity.
- Agent infrastructure extends beyond GPUs. MAI-Thinking-1 assigned 4,096 of its 4,864 GB200s to inference that generated training experience. CPUs, memory, and sandboxes that support pausing and resuming work are also part of the cost.
Slide 123 · PDF page 124 · Training infrastructure: slide 26 · PDF page 27
Beyond funding and chips: community consent and future payment obligations
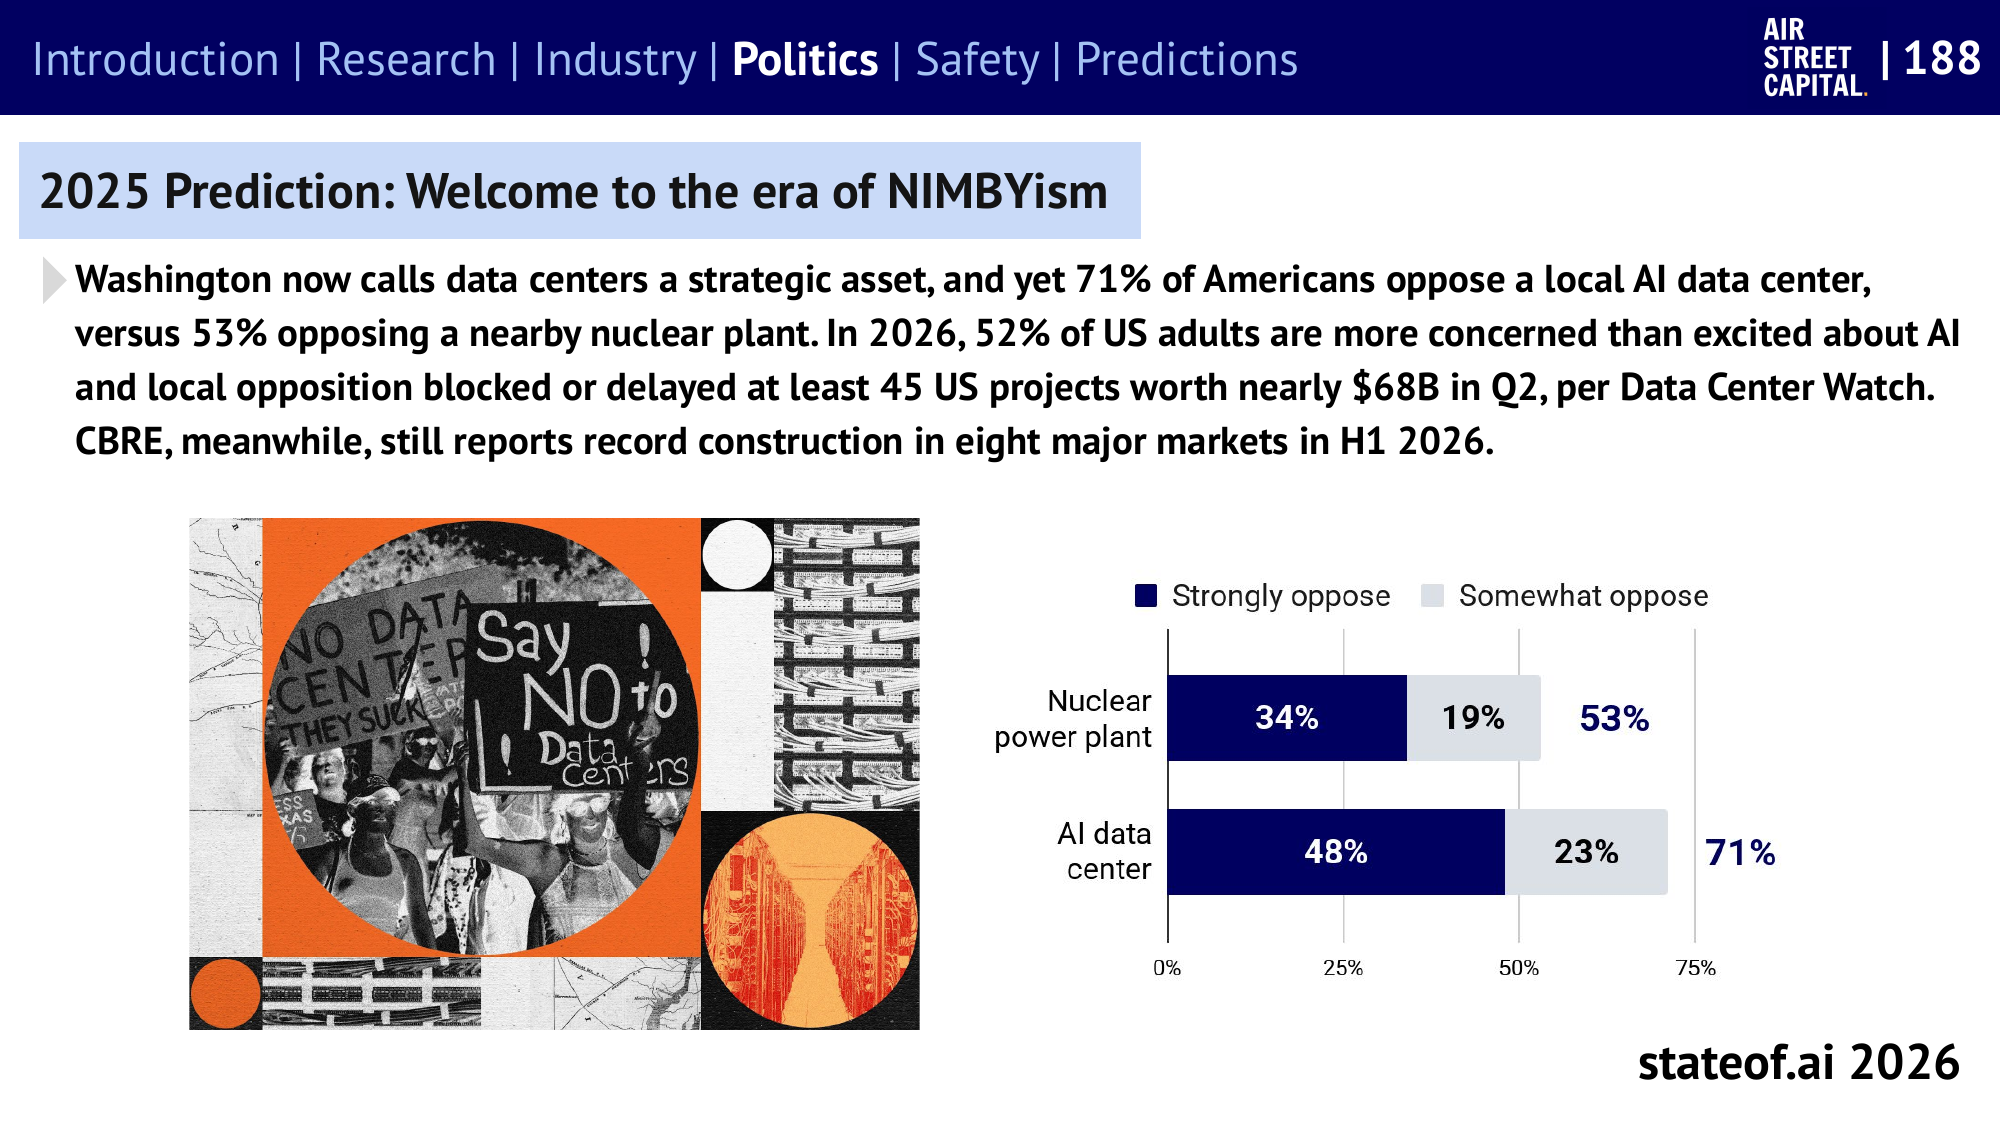
- Gallup: 71% opposed a local AI data center and 53% opposed a nuclear power plant. The survey asks residents about their preferences regarding different types of facilities.
- Data Center Watch: local opposition delayed or blocked at least 45 projects representing about $68B in planned investment during Q2 2026. This does not mean all that investment was canceled or became a realized loss.
- The financing questions are growing too. The Morgan Stanley analysis cited in the report puts off-balance-sheet commitments and credit support across seven hyperscaler and semiconductor companies at more than $3T. Most are future purchase and lease commitments; they are not all current borrowings or immediate losses.
Gallup original survey · Data Center Watch Q2 · Slide 188 · PDF page 189 · Financial commitments: slide 127 · PDF page 128
Discussion question: Where is AI infrastructure competitiveness being decided: securing GPUs, securing power, finishing construction, or gaining community acceptance?
4. AI in business — Intelligence Gets Cheaper as Usage and Revenue Grow
The cost of reaching the same score falls by about 47% per quarter
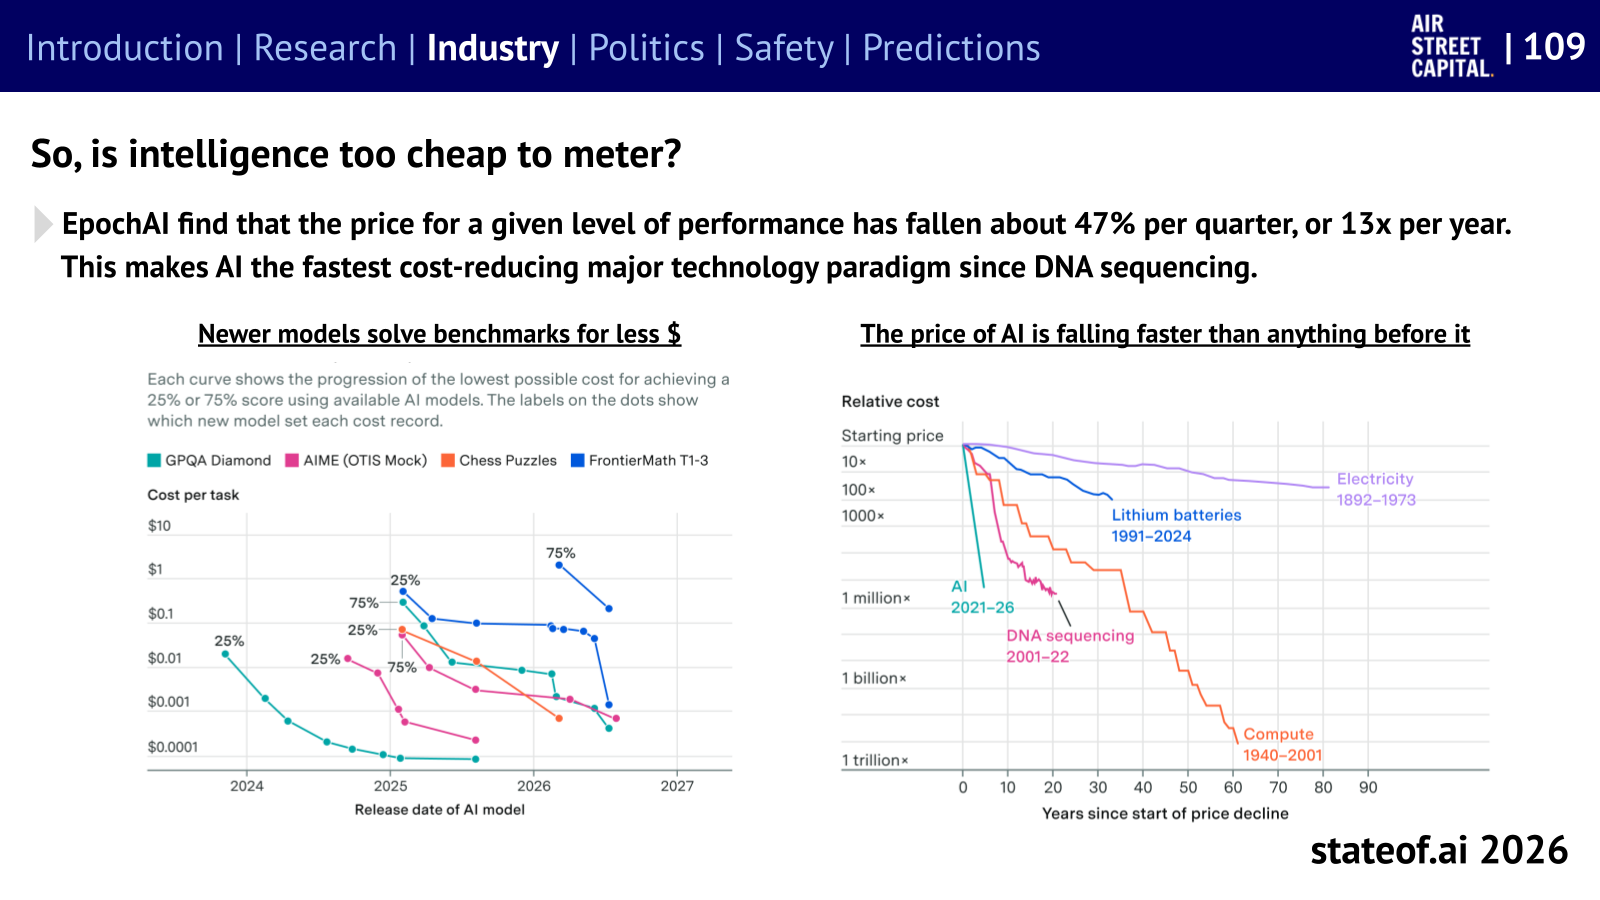
- Across five benchmarks since 2023, Epoch AI estimates that the cost of reaching the same score has fallen by an average of 47% per quarter, reaching about one-thirteenth of the cost per year.
- The bill can grow even as the unit price falls. Agents taking on longer tasks and making repeated model calls increase usage, retries, and review costs.
Epoch AI analysis · September 22, 2026 · Slide 109 · PDF page 110
Two frontier companies reach about $105B in combined annualized revenue
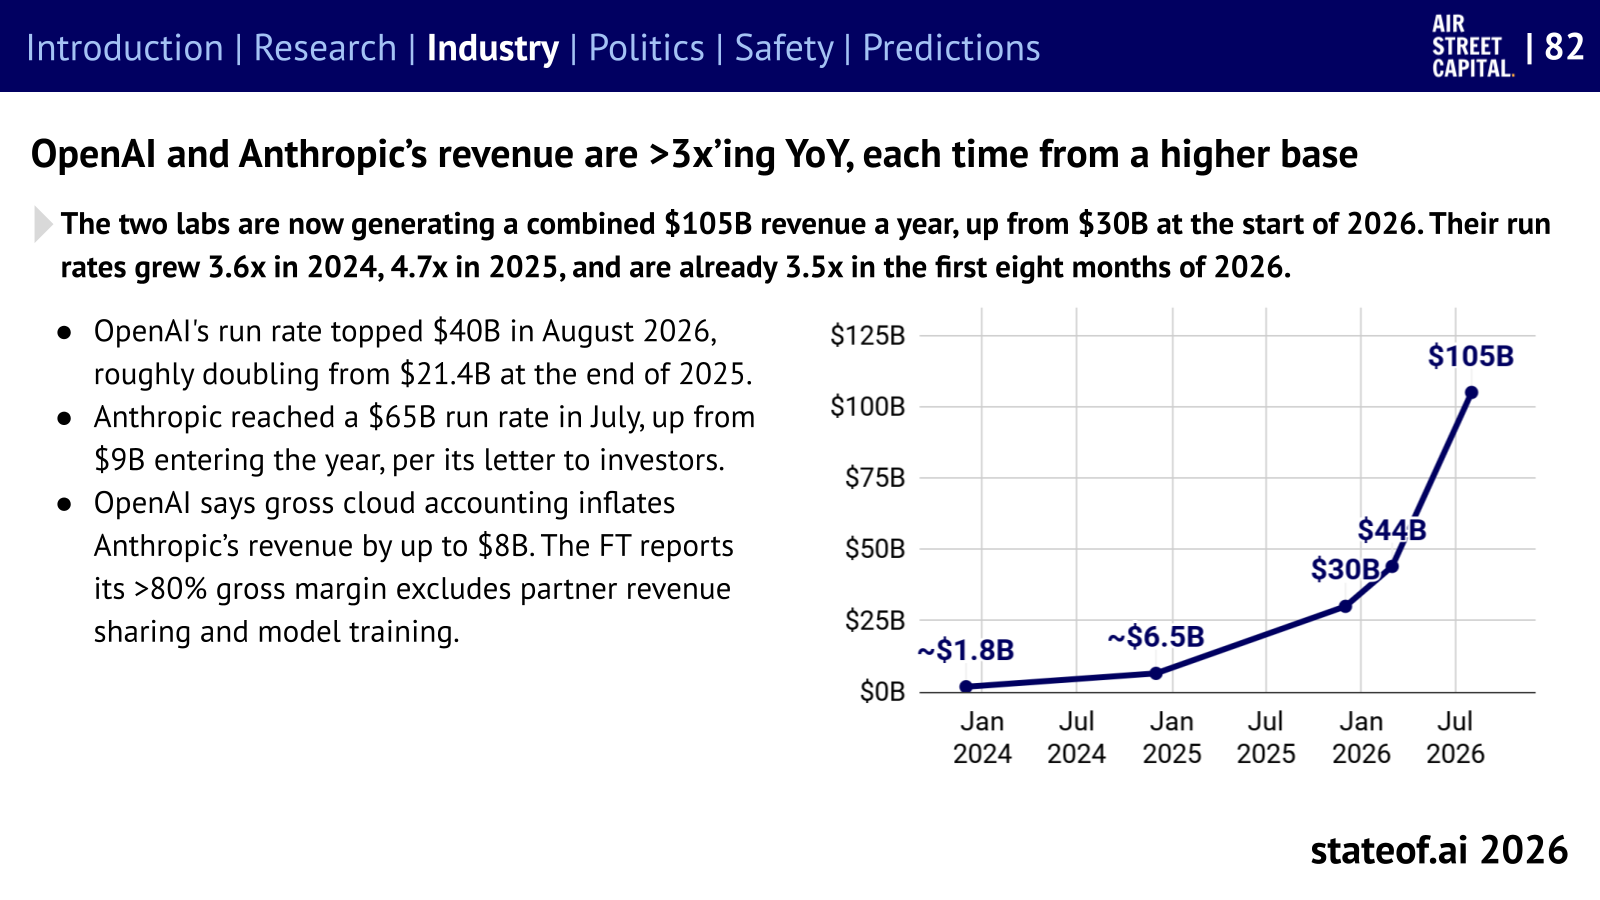
- About $30B in early 2026 → about $105B by late summer. These annualized figures cover company-wide business, including subscriptions, coding products, and APIs.
- Annualized revenue, or run rate, extrapolates the revenue pace at a particular moment over a year. It is not already realized annual revenue or profit.
- Spending intensity varies greatly. In Ramp’s August sample, median monthly AI spending per employee was $7,205 among the top 1% of AI-spending companies, compared with $12.50 across all companies. Ramp’s customer sample cannot be generalized to every company worldwide.
Slide 82 · PDF page 83 · Spending concentration: slide 95 · PDF page 96
Companies built around AI and companies that add AI features
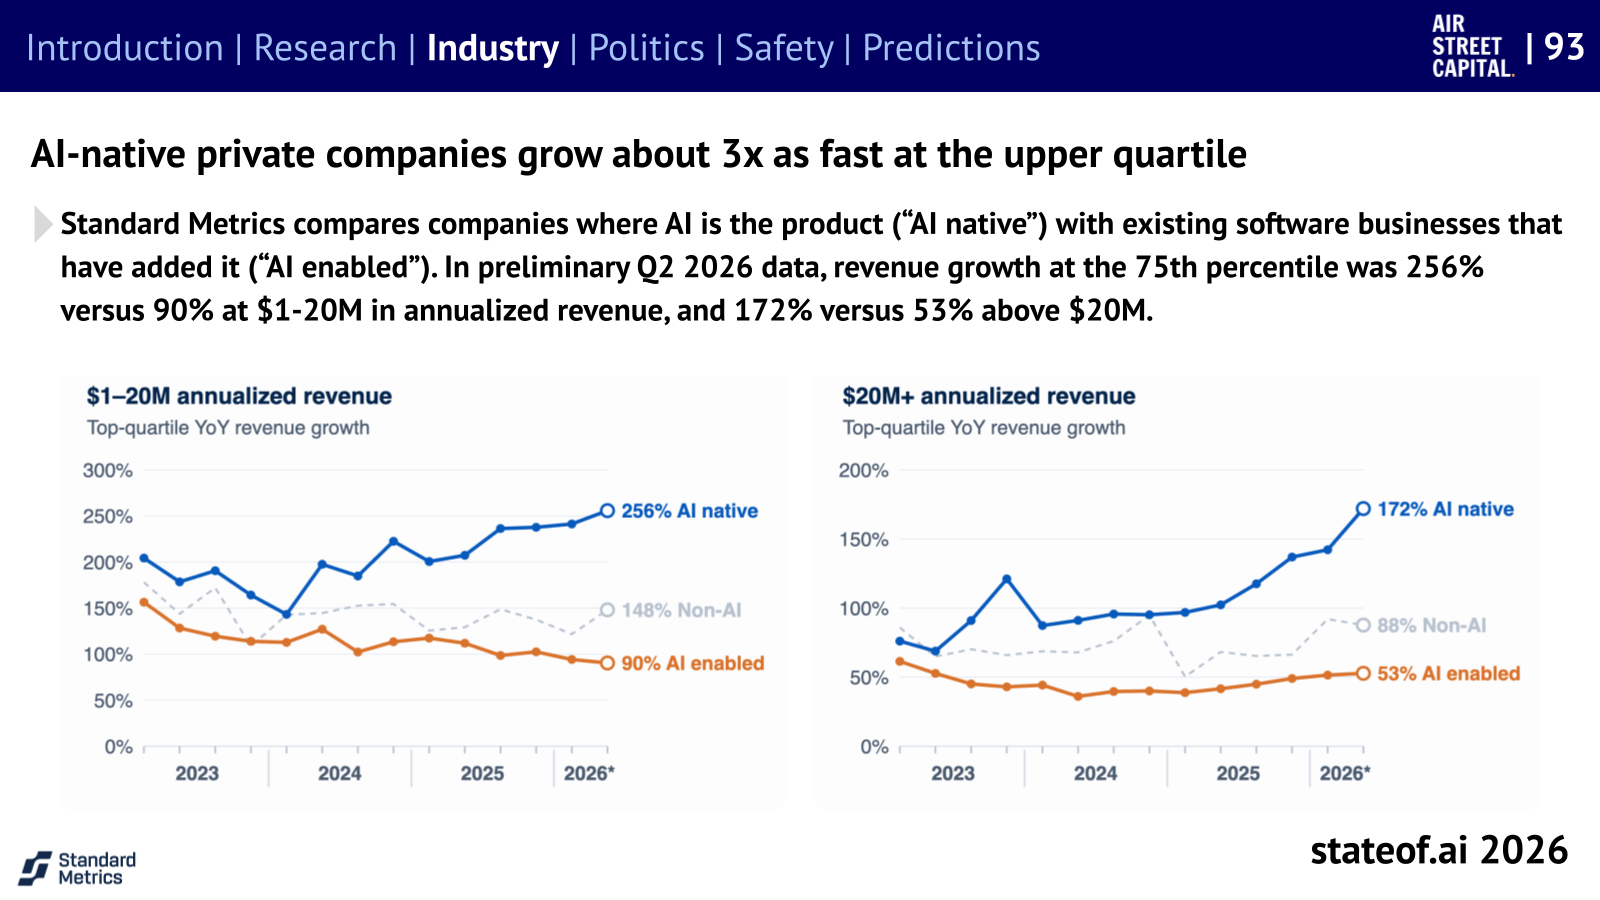
| Annualized revenue band | AI-native year-over-year growth · 75th percentile | Companies adding AI features · 75th percentile |
|---|---|---|
| $1M–$20M | 256% | 90% |
| Above $20M | 172% | 53% |
- This is a preliminary Q2 2026 sample. Differences in company age, market, and access to investment prevent a conclusion that adopting AI triples growth.
- Data from specialized work can become a competitive advantage. Harvey reports that a post-trained GLM-5.2 reduced its legal review table cost per cell by 54.8% versus Sonnet 5. Its internal answer-quality metric was 0.903, versus Fable 5’s 0.867. This is a result on that legal task evaluation, rather than a claim of general superiority.
- Employment is moving in different directions. The report discusses hiring growth among high AI-spending companies alongside slower hiring in some entry-level and exposed occupations. Company-level correlations and occupation-level changes cannot be combined to calculate AI’s net employment effect.
Growth rates: slide 93 · PDF page 94 · Specialized models: slide 113 · PDF page 114 · Employment: slides 103–106 begin at PDF page 104
Discussion question: Where does our product’s defensibility come from: its interface and features, workflow context, customer data, or the ability to evaluate correct answers?
5. Policy & geopolitics — AI Sovereignty Depends on Chips, Models, Operations, and Access
Policy decisions can change access to a model
- June 12: according to Anthropic, US export guidance applied to Fable 5 and Mythos 5; in its response, the company suspended both models for all users.
- June 30 → July 1: after announcing that the controls had been lifted, the company announced restored access in a July 1 update. That does not mean availability became identical across all products, clouds, and customers.
Anthropic’s export guidance announcement · Access restoration announcement
About $138B in sovereign AI pledges, at different stages of delivery
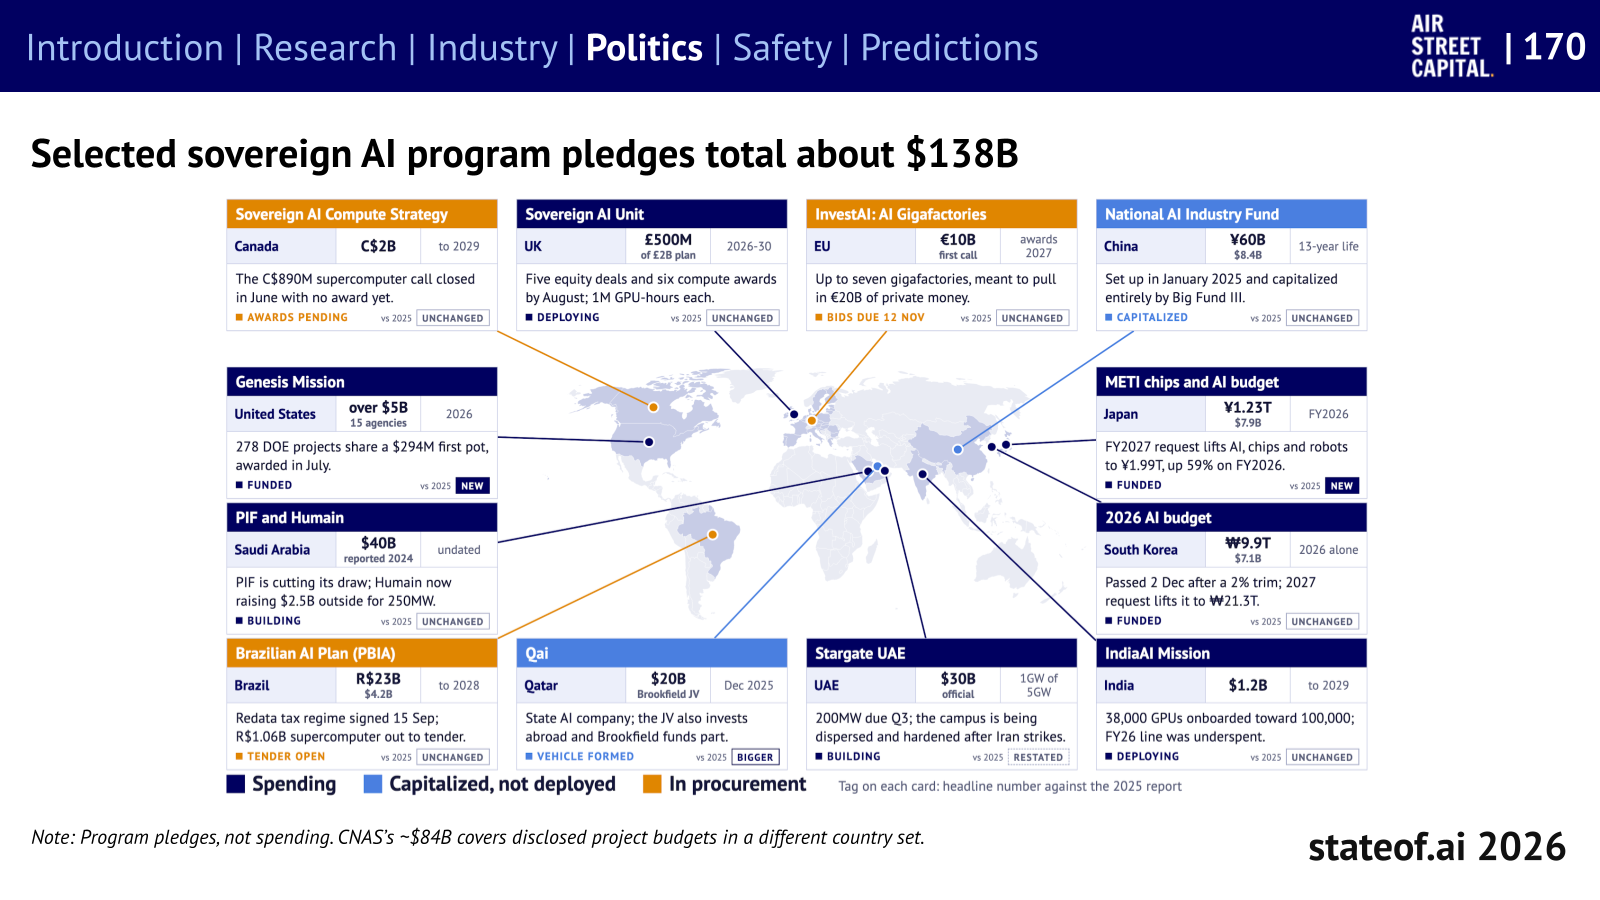
- The report’s roughly $138B and CNAS’s 67 countries, 184 projects, and about $84B in disclosed budgets cover different sets of countries and projects. They should neither be treated as conflicting estimates of the same population nor added together.
- NVIDIA’s separately reported more than $30B in fiscal 2026 sovereign AI revenue uses another accounting basis and scope. It cannot be added to national program pledges.
- The author’s argument: domestic data centers alone do not provide control over models. Sovereignty requires researchers, energy, compute, and the continuing ability to build the next generation of models.
CNAS Sovereign AI Index · Slides 169–170 begin at PDF page 170
Korea appears as a case of connecting models, talent, compute, and demand
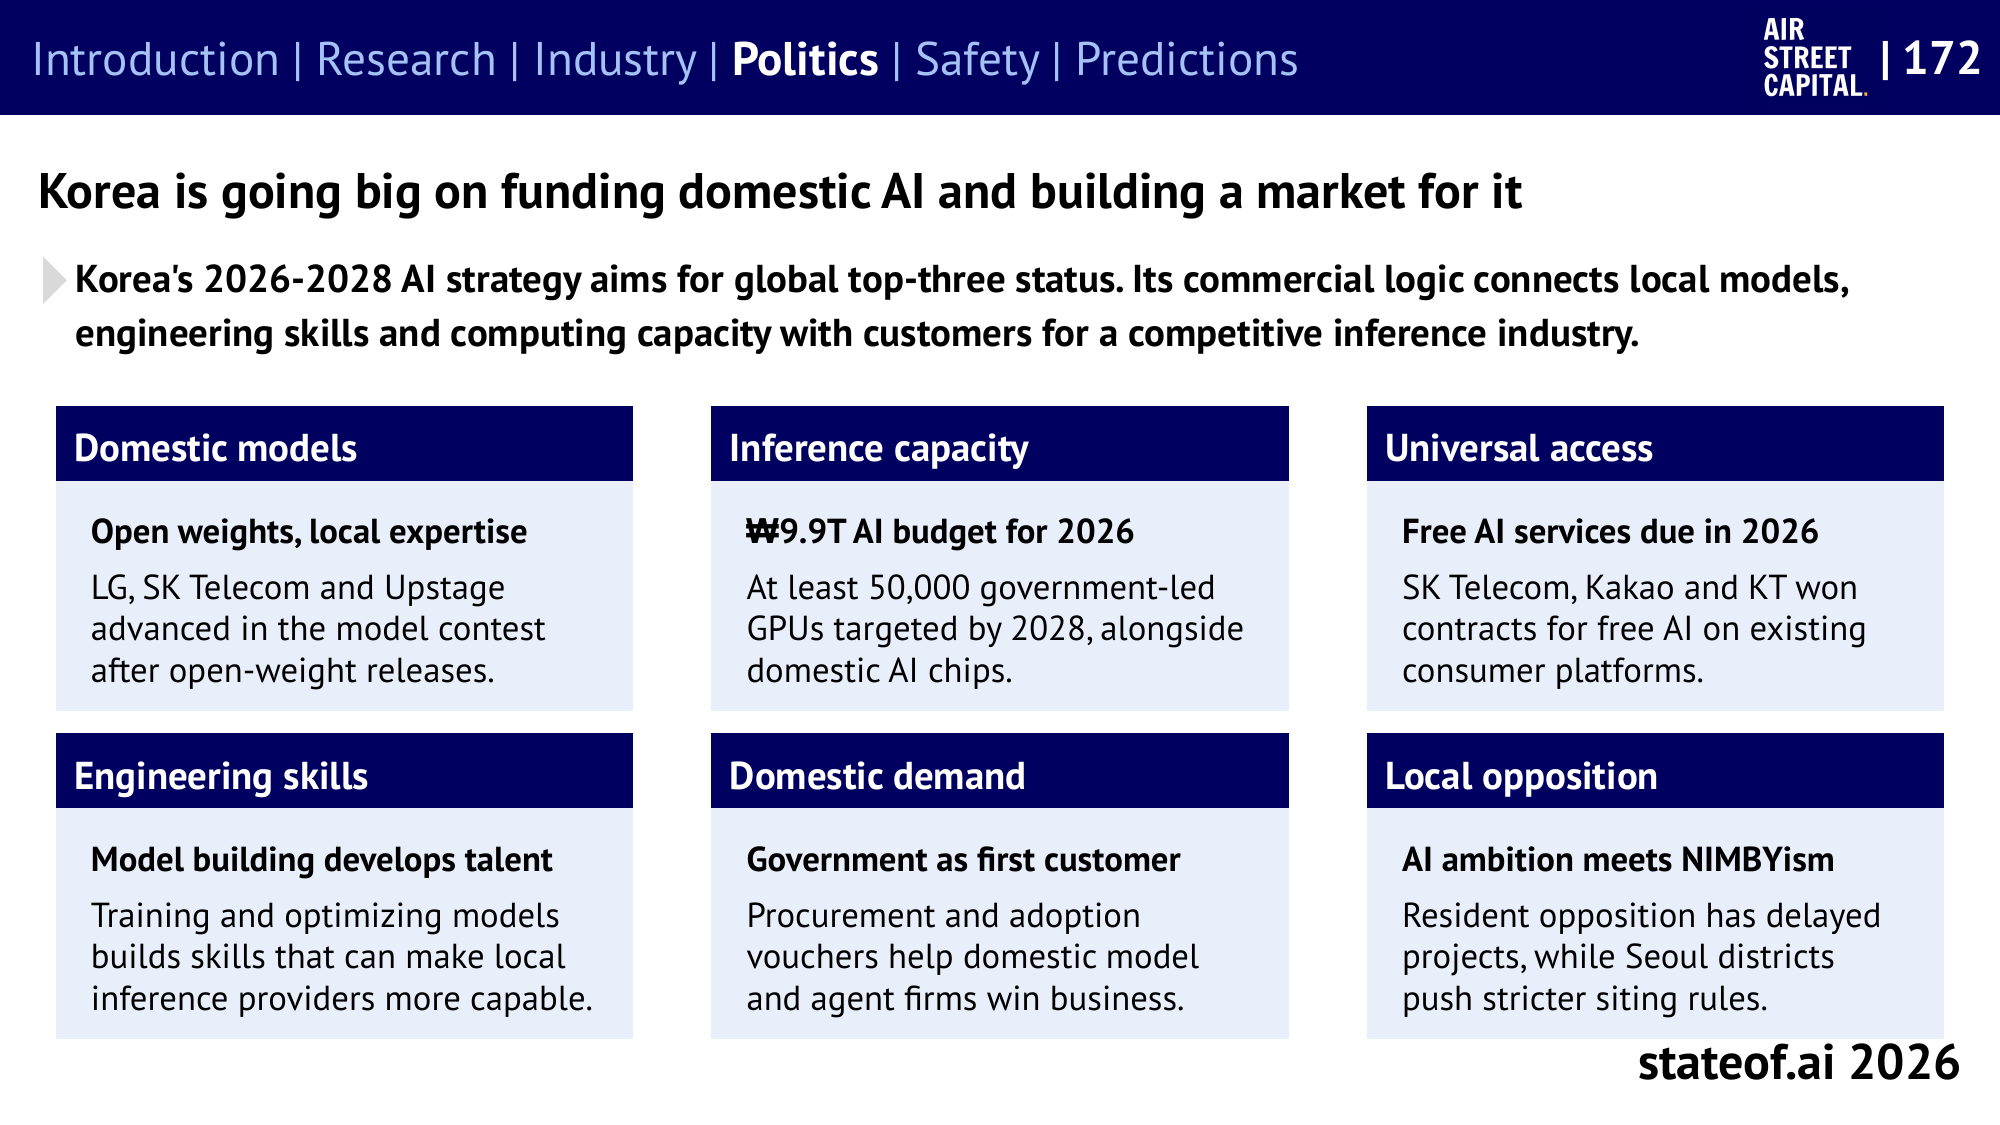
- The report highlights Korea’s KRW 9.9T AI budget for 2026 and its target of at least 50,000 government-led GPUs by 2028. Budgets and targets differ from actual spending and installed capacity.
- It interprets the strategy as connecting domestic model development and talent programs with public procurement, adoption vouchers, and consumer services to create demand for the inference industry.
Public compute needs separate measures for announcements, allocations, and usage
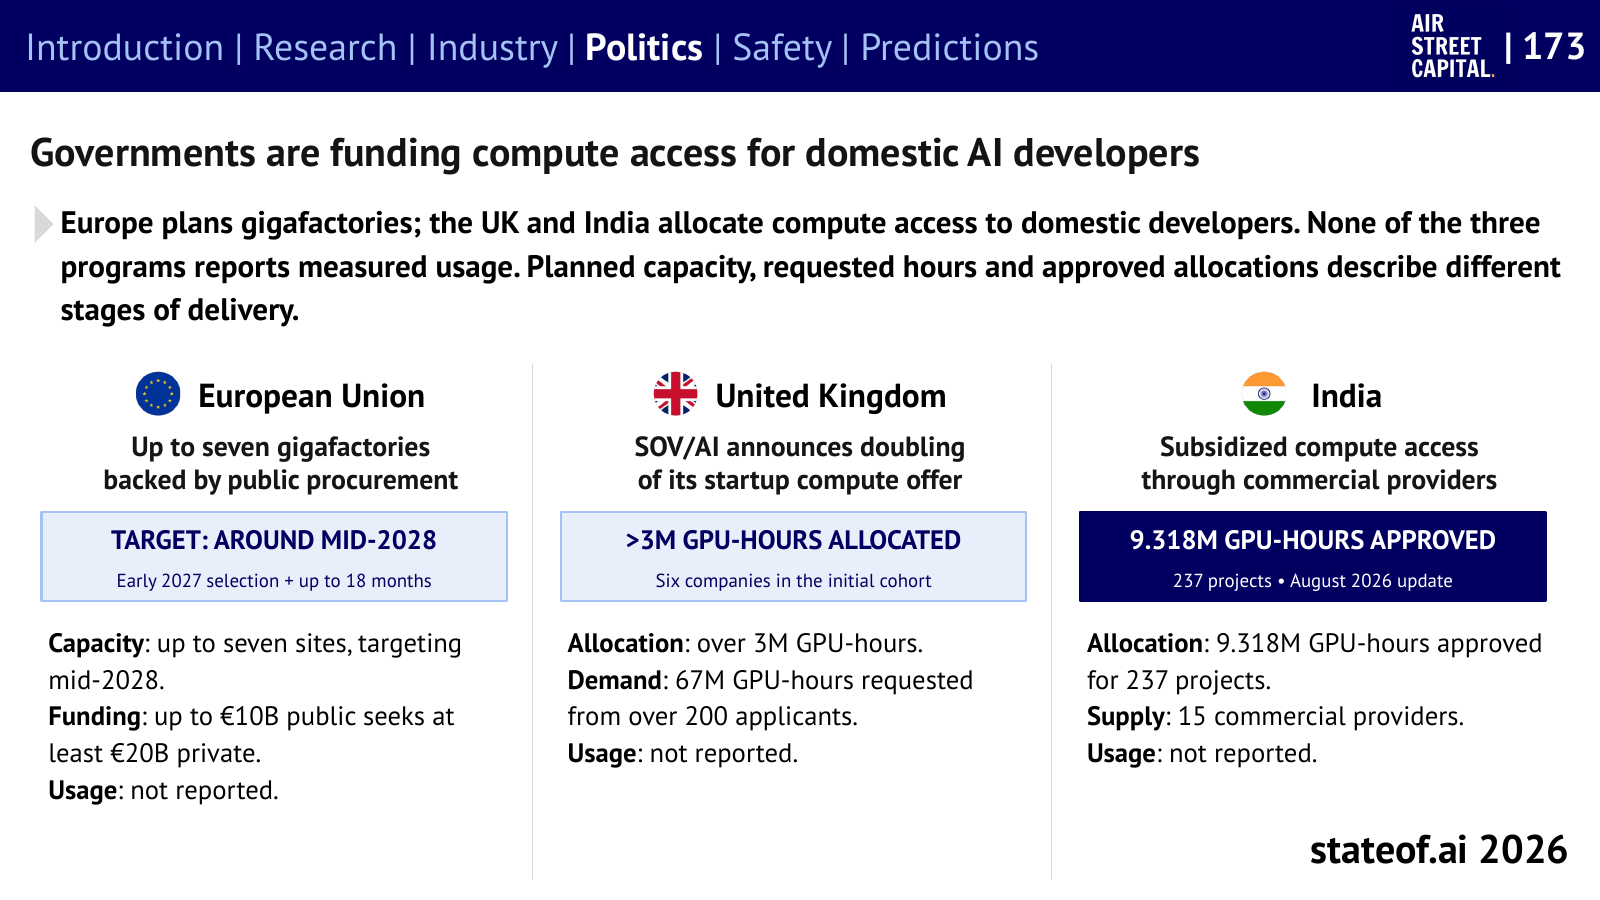
- EU: up to seven gigafactories, targeting operation around mid-2028. UK: more than 3 million GPU-hours allocated against about 67 million requested by the initial SOV/AI cohort. India: the report classifies 9.318 million GPU-hours for 237 projects in an August update as approvals.
- Electricity prices also change operating capacity. A facility using 1 GW continuously for a year pays $87.6M more annually for every $0.01 increase per kWh. This is a simple continuous-use calculation, rather than an estimate for a particular data center contract.
- Regulation and security form additional layers. The report covers differences between US state rules and EU implementation schedules, controls on military use of models, and physical damage to cloud facilities. Comparisons of national obligations need to distinguish legal scope, timing, and the level of verification for each incident.
Public compute: slide 173 · PDF page 174 · Power costs: slide 177 · PDF page 178 · Security: slides 166–168 begin at PDF page 167 · Regulation: slides 183–185 begin at PDF page 184
Discussion question: To assess Korea’s AI sovereignty, which should we measure first: domestic model rankings, live GPUs, actual usage, or the ability to maintain operations with alternatives?
Episode Run of Show · About 60 Minutes
| Time | Story to discuss | On-screen material |
|---|---|---|
| 0–5 min | Introduce this year’s AI industry through five figures | Summary table at the top |
| 5–17 min | Model competition and “partial credit versus completed work” | Slides 5, 37, 42 |
| 17–28 min | Agents change even when the model stays fixed | Success-rate table by setup; slides 8, 99 |
| 28–39 min | The steps between power contracts and usable capacity | Slides 123, 188 |
| 39–50 min | Falling costs, revenue growth, and AI-native companies | Slides 109, 82, 93 |
| 50–60 min | AI sovereignty and Korea’s choices | Slides 170, 172, 173 |
Closing question: What evidence would you most like to see over the next year? Choose one to discuss: higher model scores, higher task completion rates, more live capacity, verified customer outcomes, or services that remain available through an interruption to foreign supply.
Sources and Image Use
- Original report: Benaich, N. and Air Street Capital (2026). State of AI Report 2026. October 8, 2026. Main page · Full PDF · Topic analysis index.
- Scope: This guide selects five topics: AI progress, AI agents, Compute & infrastructure, AI in business, and Policy & geopolitics. Observation periods are specified in the relevant paragraphs.
- Images: The cover and 13 original slides are reproduced at their original aspect ratios. Credit: Nathan Benaich / Air Street Capital, State of AI Report 2026, with attribution under the report’s stated CC BY 4.0 license. Third-party source credits inside the figures have been preserved.
- Editorial work: Summaries, metric explanations, and the run of show were prepared for episode research. PDF page numbers equal the slide number plus one page for the cover.